Fig. 5
Download original image
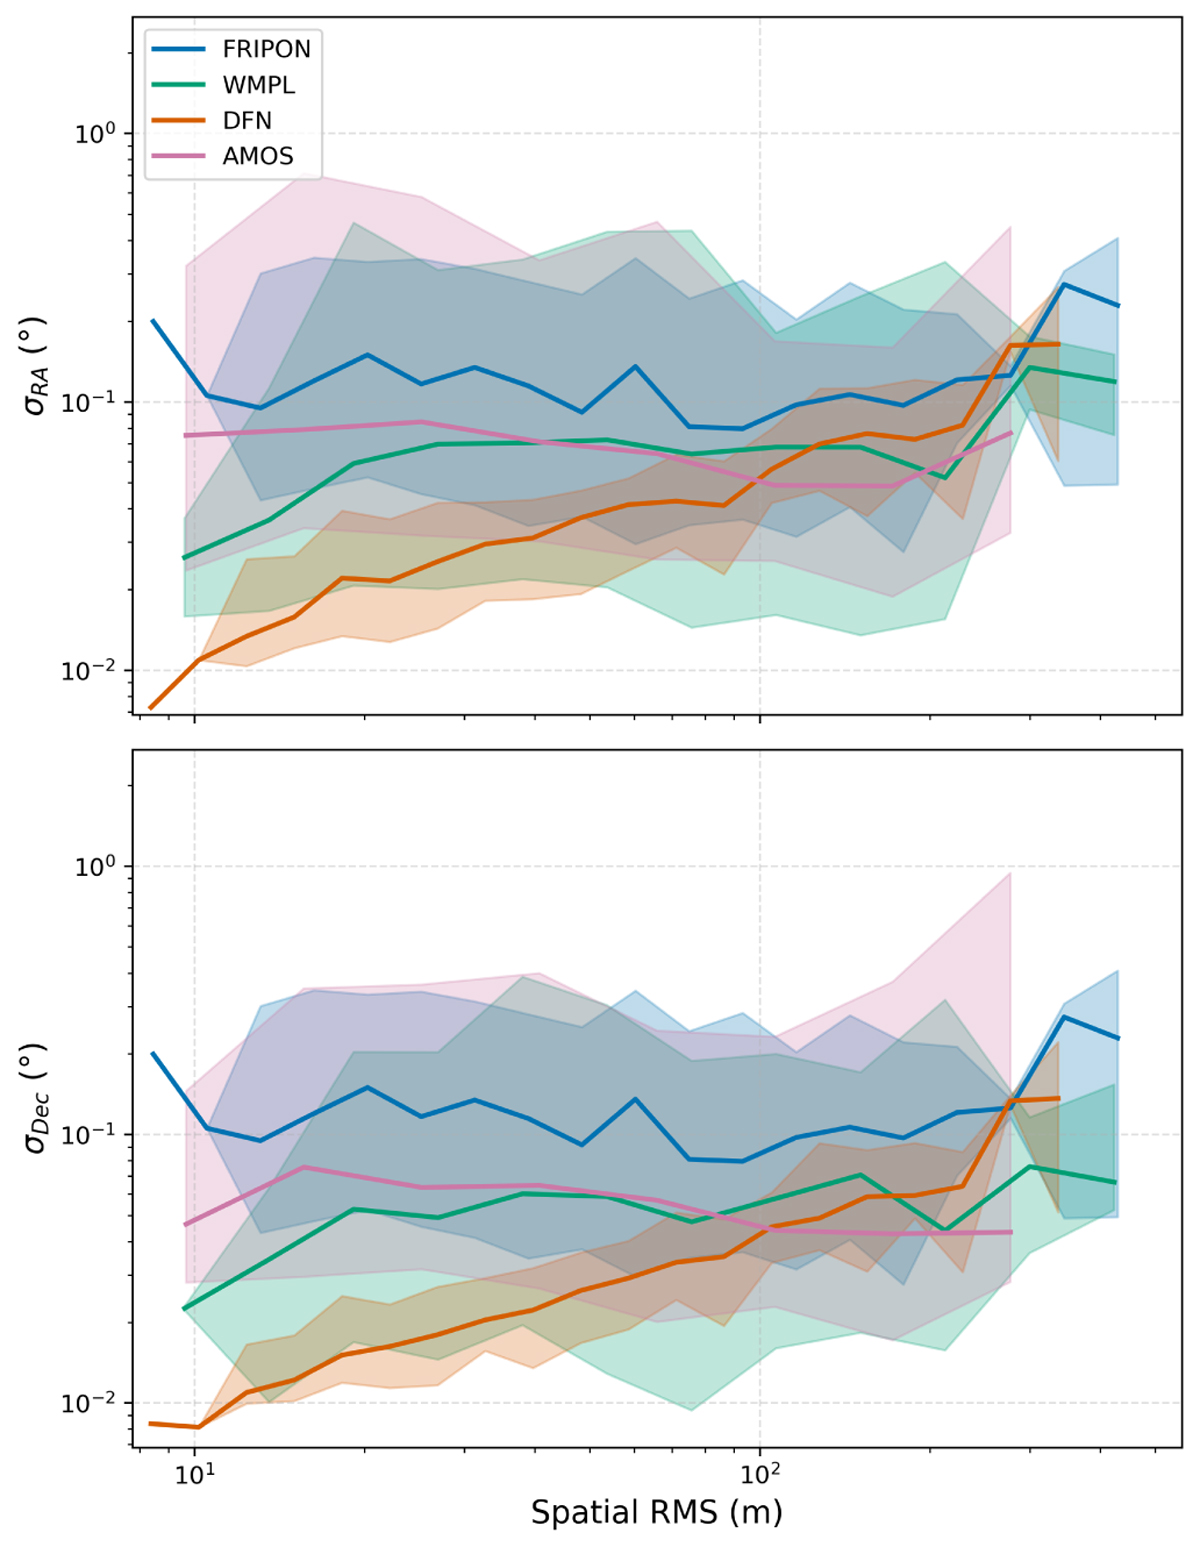
Median 1σ radiant uncertainties in (top) right ascension and (bottom) declination as a function of the trajectory-fit cross-track RMS residuals. The values are binned logarithmically in RMS. the solid line in each colour-coded curve shows the median of all events in the bin, and the shaded region encloses the 5-95% percentile range (central 90%) and illustrates the event-to-event spread.
Current usage metrics show cumulative count of Article Views (full-text article views including HTML views, PDF and ePub downloads, according to the available data) and Abstracts Views on Vision4Press platform.
Data correspond to usage on the plateform after 2015. The current usage metrics is available 48-96 hours after online publication and is updated daily on week days.
Initial download of the metrics may take a while.