| Issue |
A&A
Volume 705, January 2026
|
|
|---|---|---|
| Article Number | A65 | |
| Number of page(s) | 22 | |
| Section | Numerical methods and codes | |
| DOI | https://doi.org/10.1051/0004-6361/202554364 | |
| Published online | 06 January 2026 | |
Comparing the data-reduction pipelines of FRIPON, DFN, WMPL, and AMOS: Case study of the Geminids
1
LTE, Observatoire de Paris, Université PSL, Sorbonne Université, Université de Lille, LNE, CNRS,
61 Avenue de l’Observatoire,
Paris
75014,
France
2
Astronomical Institute of the Romanian Academy,
5 – Cutitul de Argint Street,
040557
Bucharest,
Romania
3
Space Science and Technology Centre, School of Earth and Planetary Sciences, Curtin University,
Perth,
WA
6845,
Australia
4
International Centre for Radio Astronomy Research, Curtin University,
Perth,
WA
6845,
Australia
5
Faculty of Mathematics, Physics and Informatics, Comenius University,
Bratislava,
Slovakia
6
Department of Physics and Astronomy, University of Western Ontario,
London,
Ontario,
Canada
7
STELaRLab, Lockheed Martin Australia,
Adelaide,
South Australia,
Australia
8
Service Informatique Pythéas (SIP) CNRS - OSU Institut Pythéas - UMS 3470,
Marseille,
France
9
Université Paris-Saclay,
UMR CNRS 8148,
GEOPS,
Orsay,
France
10
Institut de Minéralogie, Physique des Matériaux et Cosmochimie, Muséum National d’Histoire Naturelle, CNRS,
Paris
75005,
France
11
Laboratoire d’Astrophysique de Marseille, Aix-Marseille University, CNRS, CNES, LAM, Institut Origines,
38 rue Frederic Joliot Curie,
Marseille
13388,
France
★ Corresponding author: This email address is being protected from spambots. You need JavaScript enabled to view it.
Received:
4
March
2025
Accepted:
20
October
2025
Abstract
Context. The number of meteor observation networks has expanded rapidly due to declining hardware costs, enabling professional and amateur groups to contribute substantial datasets. An accurate data reduction remains challenging, however, because variations in processing methods can significantly affect the trajectory reconstructions and orbital interpretations.
Aims. Our goal is to thoroughly compare four professionally produced meteor data-reduction pipelines (FRIPON, DFN, WMPL, and AMOS) by reprocessing FRIPON Geminid observations. This analysis can be used for a comparison with other data-reduction methods.
Methods. We processed a dataset of 5 84 Geminid fireballs observed by FRIPON between 2016 and 2023. The single-station astrometric data were converted into the global fireball exchange (GFE) standard format for uniform processing. We assessed variations in trajectory, velocity, and radiant and orbital element calculations in the pipelines and compared them to previously published Geminid measurements.
Results. The radiant and velocity solutions provided by the four data-reduction pipelines are all within the range of previously published values, with some nuances. Particularly, the radiants estimated by WMPL, DFN, and AMOS are nearly identical, but FRIPON reports a systematic shift in right ascension (−0.3°) that is caused by an improper handling of the precession. Additionally, the FRIPON data-reduction pipeline also tends to overestimate the initial velocity (+0.3 km s−1), which is due to the deceleration model used as the velocity solver. The FRIPON velocity method relies on a well-constrained deceleration profile, but for the Geminids, many are low-deceleration events, which leads to an overestimation of the initial velocity. At the other end of the spectrum, the DFN tends to predict lower velocities, in particular, for poorly observed events. This velocity shift vanishes for the DFN when we considered Geminids alone with at least three observations or more, however. The primary difference identified in the analysis concerns the velocity uncertainties. Although all four pipelines achieved similar residuals between their trajectories and observations, their velocity uncertainties varied systematically. WMPL outputs the lowest values, followed by AMOS, FRIPON, and DFN.
Conclusions. From this Geminid case study, we find that the default FRIPON data-reduction methods, while adequate for meteoritedropping events, are not optimal for all cases. Specifically, FRIPON tends to overestimate velocities for low-deceleration events because the fit is less strongly constrained, and the nominal radiants are not correctly output in J2000. On the other hand, the other data-reduction pipelines (DFN, WMPL, and AMOS) produce consistent results, provided that the observational data are sufficiently robust, that is, more than ∼50 data points from at least three observers. A key takeaway is that we need to reevaluate how the velocity uncertainties are estimated. Our results show that the uncertainty estimates vary systematically in different pipelines, even though the goodness-of-fit statistics is generally similar. The increasing availability of impact observations from varying sources (radar, video, photo, seismic, infrasound, satellite, telescopic, etc.) calls for greater collaboration and transparency in data-reduction practices.
Key words: methods: data analysis / methods: observational / meteorites, meteors, meteoroids
© The Authors 2026
 Open Access article, published by EDP Sciences, under the terms of the Creative Commons Attribution License (https://creativecommons.org/licenses/by/4.0), which permits unrestricted use, distribution, and reproduction in any medium, provided the original work is properly cited.
This article is published in open access under the Subscribe to Open model. This email address is being protected from spambots. You need JavaScript enabled to view it. to support open access publication.
1 Introduction
Fireball observations have historically relied on film-based techniques (Ceplecha 1961; McCrosky et al. 1971; Halliday et al. 1978), but the advent of charge-coupled devices (CCDs), and more recently, complementary metal-oxide-semiconductor (CMOS) sensors, has revolutionised the scale and precision of meteor and fireball surveys (Molau 1999; Koten et al. 2019; Arlt et al. 2022).
Photographic observations generally excel in spatial resolution and yield very precise astrometric solutions, making them particularly well suited for recovering meteorites. Because photographic techniques rely on relatively few discrete exposures (e.g. one exposure spanning minutes to hours), however, they provide a limited time resolution; abrupt changes in meteor brightness, detailed velocity variations, or short-duration fragmentation episodes can be difficult to capture. By contrast, video observations use continuous frame-based recordings, typically at 25-60 frames per second (or higher). This provides near-real-time detection and automated data-processing. This frame-by-frame approach provides an excellent temporal resolution at the cost of a lower spatial resolution. This shortcoming can be mitigated by employing high-definition sensors or deploying multiple narrow-field cameras to enhance positional accuracy, however. As commercial CCDs and later CMOS sensors matured, sensitive yet affordable camera hardware proliferated in professional and amateur networks (Jeanne et al. 2019; Koten et al. 2019; Arlt et al. 2022).
Film-based photographic observatories continued into the 21st century for bright fireball observations, but as digital sensors shrank in size, improved in sensitivity, and fell in cost, analogue film gave way to digital imaging (Spurny et al. 2006; Howie et al. 2017a). This digital revolution has spawned large-scale photographic fireball observation networks that were previously infeasible due to geography or expense (Bland et al. 2012; Koten et al. 2019; Devillepoix et al. 2020), leading to a significant increase in data collection and meteorite recoveries. In the four decades between 1959 and 1999, only five meteorite falls (Pribram, Lost City, Innisfree, Benesov, Peekskill) were recovered based on instrumental observations. By comparison, in 2023 alone, meteorites from three distinct falls were recovered on three consecutive days: 13 February in France (Zanda et al. 2023), 14 February in Italy (Barghini et al. 2024), and 15 February in Texas1.
A diverse array of meteor and fireball networks now exists worldwide, ranging from higher-precision photographic systems such as the Desert Fireball Network (DFN) (Howie et al. 2017a; Devillepoix et al. 2020) and the European Fireball Network (EN) (Borovička et al. 2022b) to more modular video approaches such as Fireball Recovery and Interplanetary Observation Network (FRIPON) (Colas et al. 2020) and the Global Meteor Network (GMN) (Vida et al. 2021). Additional examples include the Spanish Meteor Network (Trigo-Rodríguez et al. 2006), the NASA All-Sky Fireball Network (Cooke & Moser 2012), the Cameras for all-sky Meteor Surveillance (CAMS) project (Jenniskens et al. 2011), the collaborative effort of SonotaCo in Japan (SonotaCo 2009), the Polish Fireball Network (Wisniewski et al. 2017), and the AMOS initiative in Slovakia (Tóth et al. 2015), as well as a growing number of amateurrun networks (e.g. all-sky7; Hankey et al. 2020). Although some focus on near-real-time frame-based video while others opt for longer-exposure higher-resolution imaging, many of the calibration and data-reduction methods are effectively the same (Koten et al. 2019). The hardware choices of each network are shaped by its scientific goals and expense limitations.
Building reliable links between observable parameters (e.g. light curves and velocity profiles) and the internal processes (e.g. ablation, mass loss, fragmentation) requires careful theoretical modelling. The flight of a meteoroid through Earth’s atmosphere involves multiple interacting processes (shock-wave generation, aerodynamic heating, ablation and mass loss, fragmentation, ionisation, and the resulting luminous emission) that each affect the meteor brightness, trajectory, and outcome. Additionally, the unknown parameters of the meteoroids, such as shape, spin, mass, and composition, further complicate this issue. Early models often adopted single-body ablation, in which the mass of a compact object with a cross section S evolves under standard drag and ablation equations (Bronshtehn 1983; Ceplecha et al. 1998). This approach remains valuable in many automated or large-scale fireball networks, where a linear or straight-line fit to the geometric path is common (e.g. Borovička 1990; Gural 2012). These simplifications can be sufficient under favourable conditions or for specific events. Recent work has underscored that fragmentation is pervasive and can drastically alter the velocity profile and final mass of a meteorite (Ceplecha et al. 1993; Borovička & Kalenda 2003; Borovička et al. 2020, 2022b,a), necessitating more robust dynamical models and careful uncertainty quantification. A primary challenge, as emphasised by Egal et al. (2017), lies in accurately deriving the velocity from photographic or video records. Many early methods that separate the geometric and velocity fits (e.g. the straight-line least-squares approach (Borovička 1990)) might underestimate uncertainties when the observation geometry is complex or when the meteoroid undergoes multiple fragmentation episodes. In particular, Egal et al. (2017) highlighted that even small systematic biases in the frame timing or astrometric precision can lead to errors in the derived deceleration profile, with direct consequences for the orbit determination. This issue becomes especially critical in scenarios of a low convergence angle or when the event has a protracted curved path. Advanced pipelines increasingly employ dynamic trajectory solvers that directly integrate the three-dimensional equations of motion of the meteorite into the data-fitting step (Gural 2012; Vida et al. 2020b; Jansen-Sturgeon et al. 2020). Rather than first inferring a simple geometric path and then fitting a velocity separately, these approaches can simultaneously solve for position and velocity at each timestep, and they often incorporate Monte Carlo or particle-filter methods to map the uncertainties more fully (Jansen-Sturgeon et al. 2020; Sansom et al. 2019b).
Along similar lines, Egal et al. (2017) stressed that reliably computing velocity requires careful propagation of all measurement errors, most critically, timing, pointing astrometry, and any potential system offsets, to avoid unrealistically low or inconsistent uncertainties. These modern methods reflect a broader push towards Bayesian or stochastic approaches that can capture the inherent complexity of meteor flight and assign more realistic error bars. While most authors now agree that velocity uncertainties below ∼0.1 km s−1 are necessary to reliably distinguish orbital source regions (Granvik et al. 2018), actual uncertainties in automated or semi-automated networks sometimes exceed this figure due to sensor calibration, partial fragmentation modelling, or constraints in the processing time. Many networks still rely on simplified single-body or straightline fits in their automated pipelines, principally for operational efficiency.
We collect increasingly more data on the meteoroids that continuously impact our atmosphere (Koten et al. 2019). It is excellent to have increasingly large meteor and fireball datasets, but we must be cautious. Despite the rapid amelioration of hardware costs, enabling the development of many more professional networks and even amateur networks, it is still complicated to analyse the collected impact data, and they are difficult to reduce. We use these data to better understand the meteoroid environment in near-Earth space and in the source regions of the meteorites, and the physical and orbital evolution of smallbody populations. Thus, we must be transparent about our data-reduction methods because slight variations or systematic errors in the data reduction can significantly alter our interpretation of the results and their implications for our understanding of small bodies in the Solar System. This is especially important as many networks, particularly video-based networks, are increasingly fully automated in their data acquisition, processing, and reduction (Molau 2001; Gural & Segon 2009; Brown et al. 2010a; Gural 2011; Weryk et al. 2013; Suk & Simberová 2017; Koten et al. 2019; Colas et al. 2020; Peña-Asensio et al. 2021; Vida et al. 2021).
In our current modern research environment, we must be increasingly adept at sharing our code so that others may test and scrutinise it. The first clear example was the observation and recovery of the Winchcombe meteorite fall in the UK in February 2021. This carbonaceous meteorite fall was observed by five different camera systems and six networks in total. The extraordinary nature of the fall and observations made it necessary for the first time to combine and coordinate the observations and pipelines of several fireball networks. This collaboration led to the development of the Global Fireball Exchange (GFE) format, which is a universal method of sharing the detailed single-station observations of a fireball event (Rowe 2021). Networks then implemented this format so that they all communicated and processed the data in coordination. This led to the recovery of the meteorite and its complete characterisation (King et al. 2022; McMullan et al. 2023).
We assess these cross-network variations and promote best practices for ensuring consistent, reliable results across different pipelines. We compare four established professionally developed fireball data-reduction pipelines, all tested against actual FRIPON network observations. Our cross-evaluation highlights differences in calibration strategies, trajectory modelling approaches, and orbital solutions and offers insights for more convergent standards in future multi-network meteor research.
The paper is organised as follows: Section 2 introduces the four contributing networks and their pipelines. Section 3 outlines the datasets and processing methods, and Section 4 compares the derived trajectories and orbital elements. We discuss the implications for a multi-network validation in Section 5, and finally, Section 6 explores strategies for improving meteor data reduction and future collaborative efforts.
2 Networks and software
2.1 FRIPON
Initiated in 2015, FRIPON is a pioneering French-led project dedicated to the detailed observation of fireballs and the recovery of meteorites. This collaborative effort now spans 15 countries on four continents, incorporating over 220 cameras covering approximately 2 million km2. Using all-sky CCD cameras that record at 30 frames per second, FRIPON achieves a data capture with a high time resolution. The network has a detection limit of about zero magnitude, making it tuned for fireball observation and meteorite recovery. Extended exposures are taken every 10 minutes to enhance astrometry and photometry, achieving effective signal-to-noise ratios up to magnitude 6 in optimal conditions (Anghel et al. 2019; Jeanne et al. 2019; Jeanne 2020; Colas et al. 2020). The automated system of FRIPON enables the swift mobilisation for meteorite recovery efforts, focusing on objects estimated to weigh 500 grams or more, by modelling the impact via photometric and dynamic methods (Anghel et al. 2021; Jeanne et al. 2019). To date, the global expansion of the consortium has aided in the recovery of five meteorites. This marks significant strides in the field of meteorite retrieval and interplanetary study (Gardiol et al. 2021; McMullan et al. 2023; Antier 2023; Barghini et al. 2024; Egal et al. 2025). The data-reduction process within FRIPON was described in detail by Jeanne et al. (2019), Jeanne (2020), and Colas et al. (2020). The processed data collected by the FRIPON project are publicly available2.
FRIPON estimates the internal error of each camera ( arcmin; Colas et al. 2020) by fitting a reference plane through all picked points along the trajectory. A local comparison (100 px box) between measured and HIPPARCOS positions gives the systematic term si (Bessell 2000). The straight-line trajectory T is obtained by minimising
 (1)
(1)
where  is the residual between the jth measure taken by the ith camera and the candidate trajectory T, si is its systematic error, σi is the internal random error of the ith camera, and ni is the number of images acquired by that camera. FRIPON uses this method to characterise the systematic errors of our cameras (e.g. a misaligned lens), but this approach does not address errors such as the camera location. To address these errors, FRIPON computes an initial estimate of the trajectory and compares the residuals with the expected random and systematic errors. If they are larger than expected for a specific camera, they iteratively decrease its weight during the calculation of the trajectory. The final systematic error is usually about 0.3 arcmin, which ends the iterative process.
The entry speed is recovered based on the single-body drag and ablation model of Bronshtehn (1983) and Stulov et al. (1995). Methods such as Gritsevich (2009) reformulated these without assuming any parameters, enabling a dimensionless coefficient approach. The FRIPON pipeline employs the method described by Jeanne et al. (2019). Although similar to Gritsevich (2009), it uses a different set of equations that do not make use of the dimensionless parameters,
![Mathematical equation: \begin{aligned} \frac{\mathrm d V}{\mathrm d t} &= -\tfrac12\,A\,\rho_{\mathrm{atm}}\,V^{2}\, \exp\!\Bigl[\tfrac{B(1-\mu)}{2A}({V^{2}-V_e^{2}})\Bigr],\\[4pt] m &= \exp\!\Bigl[\tfrac{B}{2A}(V^{2}-V_e^{2})\Bigr], \end{aligned}](/articles/aa/full_html/2026/01/aa54364-25/aa54364-25-eq4.png) (2)
(2)
with a deceleration parameter A = cdSe/Me and an ablation parameter B = chSe/(HMe), where cd is the drag coefficient, ch the heat-transfer coefficient, H the enthalpy of destruction, patm the atmospheric gas density (NRLMSISE-00 model; Lyytinen & Gritsevich 2016), m the normalised meteoroid mass, Me the pre-entry mass, s the normalised cross-sectional area, Se the preentry cross-sectional area, and μ the shape-change coefficient. Fitting the projected picks on the straight line (Jeanne et al. 2019) yields the parameters Ve, A, and B and their joint confidence region. The estimated Ve value represents the velocity at the top of the atmosphere. Within FRIPON, this is arbitrarily defined as 10 km above the first measured point.
2.2 DFN
The Desert Fireball Network (DFN), established to cover the expansive Australian outback, surveys over 2.5 million km2. This equates to over one-third of the Australian continent, underscoring the extensive observational reach of the DFN since its digital transition in 2013-2015 (Bland et al. 2012; Howie et al. 2017a). The deployment of 50 digital fireball observatories, equipped with high-resolution DSLR cameras and all-sky fisheye lenses, enables the network to achieve unprecedented capture rates of meteoroids, thereby enhancing the precision of meteoritefall position determinations through GNSS-synchronised liquidcrystal shutters (Howie et al. 2017b; Devillepoix et al. 2019). The precision and manual picking of fireball observations have resulted in a vast accurate fireball dataset that help us to understand the dynamics of centimeter- to meter-sized debris in the inner Solar System better (Devillepoix et al. 2019; Sansom et al. 2019a; Shober et al. 2020, 2021, 2025). The automated method of the DFN for determining atmospheric trajectories and extracting velocity profiles uses a refined straight-line least-squares approach coupled with an extended Kalman smoother to ensure accurate trajectory and velocity data while accounting for observational and fitting uncertainties (Borovička 1990; Sansom et al. 2015).
Expanding beyond its Australian origins, the DFN now forms the core of the Global Fireball Observatory (GFO)3, integrating ten partner networks and 18 collaborating institutions across nine countries, all employing DFN-developed observatories (Devillepoix et al. 2020). The GFO has led to the retrieval of 18 orbital meteorites in total4, representing about 30% of all meteorites recovered with known orbits to date (Bland et al. 2009; Dyl et al. 2016; Devillepoix et al. 2018; Jenniskens et al. 2019; Sansom et al. 2020; King et al. 2022; Shober et al. 2022; Devillepoix et al. 2022; Anderson et al. 2022; Brown et al. 2023).
2.3 AMOS
Based in Slovakia, the All-Sky Meteor Orbit System (AMOS)5 is an advanced global meteor observation network that uses automated intensified all-sky video cameras to track and analyse meteor events and wide-field spectral cameras to study meteoroid composition. Established in 2009 by the Faculty of Mathematics, Physics, and Informatics at Comenius University Bratislava, AMOS aims to provide coverage over Central Europe with a network currently spanning six stations in Slovakia and 17 stations around the globe in total. Other network locations include the Canary Islands, Chile, Hawaii, Australia, and South Africa. Each station has a digital CCD camera capable of recording high-resolution video (1600x1200) at up to 20 frames per second, covering a wide range of meteor magnitudes, typically between +4.0 and -3.0 in stellar magnitude, including fireballs as well Tóth et al. (2015). The primary goal of AMOS is to calculate precise trajectories and orbits of meteors and correlate them with their spectral properties studied by the AMOS-Spec cameras (Matlovic et al. 2020) to improve the knowledge of weak meteor showers and their parent-body characterisation, or to provide comprehensive studies of meteoroid dynamics, physical properties, and composition (Matlovic et al. 2019; Matlovic et al. 2022). The network has successfully integrated cuttingedge software algorithms to determine the atmospheric paths, radiant points, and orbital parameters of meteors, using methods such as the least-squares Monte Carlo fitting technique (Duris et al. 2018) for an enhanced accuracy in trajectory reconstruction (Tóth et al. 2019). These cameras are part of an integrated system designed for advanced meteor detection and analysis, contributing to research on meteor trajectories, origins, and potential recovery of meteorites.
2.4 WMPL and RMS
The Western Meteor Python Library (WMPL), developed by the Meteor Physics Group at the University of Western Ontario in Canada, is a comprehensive open-source6 toolset written in Python designed to process, analyse, and interpret the observational data obtained from various meteor-detection systems, facilitating the detailed analysis of meteor trajectories. The library includes a variety of commonly used methods in the meteor field (Vida et al. 2018), a novel meteor trajectory solver (Vida et al. 2020b), a novel method for meteor shower massindex estimation (Vida et al. 2020a), implementation of the Borovička et al. (2007) faint meteor model (Vida et al. 2024), and implementation of the Borovička et al. (2013) semi-empirical fireball fragmentation model (Vida et al. 2023).
Applicable to this work, the WMPL meteor trajectory solver uses the geometric and dynamical data to constrain meteor trajectories, and it applies rigorous statistical methods, including Monte Carlo simulations, to fully propagate the uncertainties in all observed trajectory parameters and derived orbital elements. The transparent nature of WMPL represents a significant step towards standardising the method used in the field. WMPL has been adopted as the main trajectory-analysis toolset for several major meteor networks, including the originating Global Meteor Network (Vida et al. 2021), all-sky7 (Hankey et al. 2020), the UK Meteor Network (Campbell-Burns & Kacerek 2014), and the NASA fireball network (Cooke & Moser 2012).
In addition to WMPL, the Raspberry Pi Meteor Station (RMS) library7 provides universal tools for reducing optical meteor data (photographic and video) by implementing the latest astrometric and photometric calibration methods (Vida et al. 2021). The measurements made by RMS tools are fully compatible with the international standards (Rowe 2021) and can be transparently used in WMPL.
3 Methods
3.1 FRIPON observations
When meteor data are integrated and compared for different networks, it is crucial to account for variations in hardware, observing cadence, exposure lengths, network density, and calibration and reduction methods. These factors can significantly affect the accuracy of the trajectory and origin estimations and the overall interpretation of the meteor data. These factors range from sensor resolution and frame rate to the specific observational strategies employed and directly affect the accuracy and precision of the derived trajectories, orbital elements, and their corresponding uncertainties.
The FRIPON observatories use a CCD Sony ICX445 chip with 1296 × 964 pixels and a pixel size of 3.75 × 3.75 μm. The lens is a fisheye with a 1.25 mm focal length opened to f/2, giving a pixel scale of 10 arcmin (Colas et al. 2020). The resolutions of these observatories are lower than those used by the EN or DFN (∼ 1-2 arcmin, i.e. 5-10× the resolution), which both use automated fireball observatories with high-resolution DSLR cameras (Howie et al. 2017a; Borovička et al. 2022b). Despite the lower optical resolution of the FRIPON sensors, the network operates and aims to recover meteorites through its higher network density and increased frame rate. The CCD observations made by FRIPON observatories are captured at 30 frames per second. Additionally, FRIPON cameras have a target spacing of 80 km compared to the 100-150 km of the higher-resolution DSLR systems (Howie et al. 2017a; Colas et al. 2020). This tighter station spacing and increased sampling rate rely on the law of large numbers and were found to adequately reduce the uncertainties on the trajectories for FRIPON (Jeanne et al. 2019). The unique approach of FRIPON, which ues a dense network of lower-resolution cameras capturing at higher frame rates, enables effective triangulation and photometric measurements across a wide field of view, despite the lower resolution of individual cameras.
Comparison of trajectory, velocity solvers, and outlier removal approaches.
3.2 Data processing
This study focused on FRIPON observations of Geminid meteor shows during 2016-2023 (584 fireballs). The goal was to determine the differences in the results between the data-reduction pipelines of FRIPON, DFN, AMOS, and WMPL (as summarised in Table 1). The FRIPON pipeline was initially used to process the observations and make the astrometric reductions. For a description of the astrometric reduction method of FRIPON, we refer to Jeanne et al. (2019). Afterwards, the single-station observations were converted into the GFE8 standard format for processing by the three other data-processing pipelines (Rowe 2021). Astrometric calibration is highly network-specific and cannot realistically be rerun in four independent codes for this comparison. DFN solves a single long-exposure DSLR frame that contains ∼103 reference stars (Howie et al. 2017a), WMPL/RMS derives solutions from 88° × 48° HD video with typically 50-200 stars per stack (Vida et al. 2021), and low-resolution FRIPON cameras must integrate a dedicated 5 s exposure and merge a few dozen detections from many epochs to reach a > 100-star solution (Jeanne et al. 2019). AMOS performs all-sky video astrometry based on the procedure of Borovička et al. (1995) with typically 100-300 stars. Porting these four very different astrometry strategies into a single cross-network astrometric pipeline would be a major software project and is beyond the scope of the present work. We instead rely on the published FRIPON solutions (median ≃1 arc-min residuals; Jeanne et al. 2019) as a common quality-controlled baseline for the trajectory and orbit comparison that follows.
Several methods have been developed to identify meteor showers and assess orbital similarity. The earliest was the D-criterion introduced by Southworth & Hawkins (1963), which calculates orbital similarity based on the orientation (i, ω, Ω), perihelion (q), and shape (e) of the orbits. Improvements to this approach were proposed by Drummond (1981), Jopek (1993), and Jopek et al. (2008). Jenniskens (2008), on the other hand, proposed a criterion rooted in dynamical arguments, which evaluates the likelihood that a meteoroid stream is associated with a parent body by considering how the orbital evolution due to secular perturbations aligns the orbits over time.
We applied a distance function, DN, based on four geocentric quantities directly linked to observational data, as proposed by Valsecchi et al. (1999). Unlike conventional orbital similarity criteria, which rely on comparing derived orbital elements, the DN method operates in a multi-dimensional space defined by the independently measured physical quantities. It incorporates components of the geocentric velocity at the Earth encounter and introduces two near-invariant variables that account for the effects of secular perturbations on meteoroid orbits. This focus on directly observable quantities offers a more robust approach to identifying meteor showers and minimises the reliance on derived parameters that can be subject to larger uncertainties.
To ensure reliability, a threshold of DN < 0.1 was chosen, as Shober & Vaubaillon (2024) demonstrated that this value maintains a false-positive rate < 2.5% for EN meteor showers.
Consequently, based on similar statistics, more than 97.5% of the meteors identified here are expected to be confidently classified as Geminids.
Nominal median measurements of the Geminid meteor shower.
4 Results
The Geminid meteor shower, known for its robust and consistent activity in mid-December originating from 3200 Phaethon, has been extensively monitored by the FRIPON network from 2016 to 2023. We have compiled and analysed observations of 584 FRIPON-observed Geminid fireballs. This dataset provides a substantial basis for evaluating the efficacy and consistency of four distinct meteor data-reduction pipelines (FRIPON, DFN, AMOS, and WMPL) while also providing a new analysis of the Geminid meteor shower. Furthermore, the results can also be compared against historically established values for the radiant, velocity, and orbital elements of the Geminids estimated by five separate studies completed over the last 20 years and documented by the IAU Meteor Data Center9.
Table 2 summarises the resulting median values from the four pipelines alongside established values from the aforementioned studies, providing a comprehensive comparison across multiple methods. This table displays a general consistency of the radiant and velocity estimates obtained from the different pipelines with prior recorded data. Although the pipeline results are generally congruent with the established records, there are discernible, if minor, systematic variations attributed to each pipeline. To visualise all pairwise differences between pipelines, we provide compact ∆-matrix histograms in Appendix A for the radiants (Figs. A.1, A.2), geocentric speed (Fig. A.3), and orbital elements (Figs. A.4–A.8).
4.1 Velocities
Previous velocity estimates for the Geminids meteor shower, as shown in the top six rows of Table 2, reported a 1.5 km s−1 range of the nominal median values for vg. Typically, the video observations reported the slowest speeds (33.5-33.8 km s−1; SonotaCo 2009; Jenniskens et al. 2016), which is linked to previous findings that video observations tend to underestimate the Gem-inid velocities (Hajduková Jr et al. 2017). Photographic observations of the Geminids tend to be slightly faster (34.6 km s−1; Jopek et al. 2003), but the IAU Meteor Data Center (MDC) only lists one study that used 51 older legacy Harvard photographic plate observations (1940s-1950s), along with five Meteorite Observation and Recovery Project (MORP) observations (1971-1985), and 223 photographic observations by the Dutch Meteor Society (1972-1996). More recent photographic EN observations of Geminid fireballs report slightly lower speeds (∼34.1 km s−1; Borovička et al. 2022b; Henych et al. 2024). Finally, radar observations of the Geminids have the highest velocities (34.5-35.0 km s−1; Jopek et al. 2003; Brown et al. 2010b).
The four tested pipelines provide an estimate of the velocity in the lower range of previously published values. The maximum velocity difference is 1.4 km s−1 (35.0 km s−1 from Brown et al. (2008) and 33.6 km s−1 from DFN; this work). The lowest nominal velocity of the shower was reported by SonotaCo (2009), however, with a given velocity of 33.5 km s−1. The AMOS and WMPL data-reduction pipelines yield very similar median geocentric velocities (∼33.8 km s−1 ), while the DFN median value is slightly lower (33.6 km s−1) and that of FRIPON is higher (34.0 km s−1). While relatively minor, these differences might be crucial for an accurate stream modelling and affect the interpretation of expected activity. As shown in Fig. 1, where pre-luminous deceleration corrections are applied to all v∞ estimates, the deviations between the estimated v∞ values of the four pipelines persist. In other words, the velocity deviations are not explained by pre-luminous deceleration and likely stem from the triangulation or velocity solver used (Table 1). For an asteroidal composition observed by a FRIPON-like system, the median estimated pre-luminous deceleration is only 25 m s−1 (Fig. 2). The corresponding pairwise distributions of ∆vg are provided in Appendix A (Fig. A.3).
 |
Fig. 1 Distribution of v∞ corrected for pre-luminous deceleration using the model of Vida et al. (2018). The dashed vertical line and corresponding value correspond to the median v∞. |
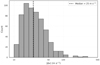 |
Fig. 2 Pre-luminous deceleration estimated for the 584 Geminid FRIPON fireballs using the model of Vida et al. (2018), showing that >98% experienced a deceleration lower than 100 m/s before detection. The dashed vertical line indicates the median value. |
4.2 Radiants
Fig. 3 shows the calculated radiant distributions, which closely agree with those recorded in earlier studies, such as those by Jopek et al. (2003) (MORP, Dutch Meteor Society, Harvard) and Jenniskens et al. (2016). Very slight deviations are observed, particularly in the right ascension values. The nominal right ascension values reported by the four other previous studies (A, C, D, and E in Table 2) are notably lower than any of the distributions produced here by the four different pipelines, providing strong evidence that this difference is real for the FRIPON Geminid dataset. As illustrated in Fig. 4, there is also a discernible variation in the computed radiants when comparing the results from different pipelines relative to those calculated by the FRIPON automated system. The DFN, AMOS, and WMPL radiants are all almost identical, displaying only slightly lower declinations (-0.1°), but much higher right ascensions (+0.3°) than the radiants calculated by the FRIPON pipeline. Full pairwise comparisons for ∆RA and ∆Dec across all pipelines are shown in Appendix A (Figs. A.1 and A.2).
To comprehensively analyse the distribution of radiants, we also quantified the spread and skew of the geocentric radiant measurements. The spread was characterised using principal component analysis (PCA) of the two-dimensional (RA, Dec) distribution, allowing us to identify the semi-major and semiminor axes of the distribution ellipse. These axes correspond to the square root of the eigenvalues of the covariance matrix, scaled to represent a 3 σ dispersion along the directions of greatest and least variance. Skewness was computed separately for RA and Dec to quantify any asymmetry in the distribution around its mean. Positive skew indicates a longer tail to the right (higher values), while negative skew indicates a longer tail to the left (lower values). Symmetric distributions exhibit skewness near zero.
All four pipelines produce similar radiant distributions and ranges, with standard deviations for RA all concentrated around 0.74° and Dec ranging from 0.43° to 0.51°. The 3 σ PCA spread is found to be generally around (2.2° × 1.3°). All pipelines show similar moderate negative skew in RA and Dec, indicating a slight asymmetry with a bias towards lower RA and Dec values. The RA skew values range between −1.0 to −0.8, and Dec skew with a larger diversity from −3.03 to −0.20. The Dec skewness is more pronounced for AMOS (−3.0), primarily due to a small number of outliers.
Additionally, in accordance with several previous works, we also calculated the median absolute angular offset from the mean radiant for each pipeline. These offsets are 0.45°, 0.47°, 0.45°, and 0.48° for FRIPON, DFN, WMPL, and AMOS, respectively.
For reference, Moorhead et al. (2021) found a median offset of 0.38°) for 1279 Geminids observed by GMN, and Kresák & Porubcan (1970) found a 0.49°) value based on 82 observations.
All four pipelines deliver similar radiant precision, but the 95% confidence region of the DFN pipeline is lowest (Table 3). The median σRA and σDec cluster tightly around 0.02-0.11°. Fig. 5 compares 1σ radiant uncertainties against the crosstrack RMS. DFN is the only pipeline whose uncertainties scale strongly with the RMS (Spearman ρ ~ 0.7), but the other pipelines show only weak correlations (ρ <0.2). This occurs because for this FRIPON comparison alone, we supplied the DFN pipeline with a single fixed measurement noise value for every pick. When the residuals exceeded this assumption, the EKF inflated the model covariance, resulting in higher radiant σ values. In contrast, WMPL, AMOS, and FRIPON weight astrometric noise on a per-pick basis, and their sigma-to-RMS correlations therefore remain weak (ρ <0.2). Nevertheless, the vast majority of individual uncertainties are well below the observed radiant dispersion of the Geminid stream (Fig. 3). This confirms that it can discern substructure from FRIPON observations.
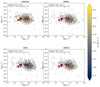 |
Fig. 3 Calculated geocentric radiant distribution for the Geminid meteor showers based on FRIPON observations between 2016-2023. The six black points with crosses indicate radiants identified from previous studies of the Geminids (A: Jopek et al. 2003, B: Brown et al. 2008, C: SonotaCo 2009, D: Brown et al. 2010b, E: Jenniskens et al. 2016). The nominal values for the four pipelines and previous results can also be found in Table 2. |
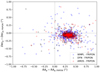 |
Fig. 4 Variation in the FRIPON-observed Geminid fireball radiants calculated by the DFN, AMOS, and WMPL data-reduction pipelines relative to those calculated by the FRIPON automated pipeline. |
One-sigma single radiant measurement uncertainties for the FRIPON Geminid sample.
4.3 Velocity uncertainties
A systematic difference emerges in the reported velocity uncertainties across the networks. This variation in the uncertainties is clearly illustrated in Fig. 6, where 1σ velocity uncertainties are plotted against the spatial RMS of the cross-track residuals of the trajectories fitted by each pipeline. Although all pipelines exhibit comparable RMS values, which indicates a similar goodness-of-fit in the trajectory modelling, the derived velocity uncertainties differ markedly. In particular, the WMPL pipeline consistently reports the lowest uncertainties, followed by AMOS, then FRIPON, and the DFN pipeline exhibits the highest uncertainties despite similar and nearly identical RMS distributions.
These findings underscore a critical challenge in the analysis of meteor trajectories: While multiple pipelines can achieve similar trajectory fits, their approaches to estimating velocity uncertainties diverge significantly. Since accurate uncertainties are essential for a reliable orbital characterisation, this inconsistency affects subsequent interpretations of the meteoroid stream dynamics. Therefore, it is crucial to discuss the uncertainty quantification across pipelines for improving the robustness and comparability of meteor observations and the derived orbital parameters.
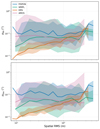 |
Fig. 5 Median 1σ radiant uncertainties in (top) right ascension and (bottom) declination as a function of the trajectory-fit cross-track RMS residuals. The values are binned logarithmically in RMS. the solid line in each colour-coded curve shows the median of all events in the bin, and the shaded region encloses the 5-95% percentile range (central 90%) and illustrates the event-to-event spread. |
5 Discussion
Our comparative analysis across the four pipelines FRIPON, DFN, AMOS, and WMPL indicated that while the nominal radiant and velocity estimates derived from DFN, AMOS, and WMPL are largely consistent, the FRIPON pipeline shows subtle but notable systematic deviations. Specifically, the FRIPON radiant exhibits a right ascension that is lower by approximately 0.3° than the median 113.9° reported by DFN, AMOS, and WMPL, accompanied by a marginally larger declination distribution. Additionally, FRIPON tends to produce geocentric velocities that are higher by 300-500 m s−1 than the medians provided by the other pipelines. Although the spread and skew of the velocity distributions among DFN, AMOS, and WMPL are similar, the velocity uncertainty estimates vary systematically across all networks, with DFN reporting the largest uncertainties and WMPL the smallest. These small systematic offsets propagate into the orbital elements (the pairwise ∆a, ∆e, ∆i, ∆ω, and ∆Ω distributions are summarised in Appendix A (Figs. A.4–A.8)).
5.1 Outliers
As shown in Table 1, the FRIPON network employs a fully automated data-reduction pipeline designed to minimise meteorite recovery times. Candidate events are detected and matched across stations, and the trajectory is solved without human intervention (Jeanne et al. 2019; Colas et al. 2020; Anghel et al. 2023). The survey is optimised for bright, multi-station fireballs (peak magnitude Mp < 0), and each event is therefore typically recorded by several cameras. This redundancy, together with built-in pixel-level vetoes for slow artefacts (e.g. the Moon, street lamps, or aircraft), means that most spurious picks are either never linked to an event or are down-weighted during the leastsquares fit of Eq. (1). In practice, only a few percent of the frames have to be rejected, and the residual false detections affect the final bright-flight line only little.
In contrast, the DFN does not automate the fireball-picking step, which leads to precise trajectories and no outliers. Further manual refinement is also done for potential meteorite-dropping events. Thus, the DFN pipeline does not include outlier detection by design. As a result, when initially fed FRIPON data containing false detections and large residuals, the DFN solver often failed because it is designed to raise errors when it encounters large residuals during trajectory determination. Similarly, the AMOS pipeline encountered difficulties with FRIPON data.
Many FRIPON observations required manual cleaning before AMOS was able to process them. When bad data were not removed, the resulting trajectories and orbital solutions deviated significantly, which underscores the importance of effective outlier rejection. These issues highlight the need for rigorous pre-processing of fireball observation files as well as the tighter radiant and velocity distribution output by the FRIPON pipeline.
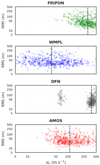 |
Fig. 6 Variation in the RMS of the cross-track spatial residuals (m) for the trajectory fitting vs. the velocity uncertainty estimated by each pipeline. The vertical dashed lines indicate the median value. All pipelines have relatively equal RMS ranges, but the velocity uncertainties differ systematically. |
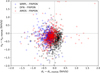 |
Fig. 7 Comparison of the velocity and velocity uncertainty of Gemi-nid meteor shower FRIPON events processed by the DFN, AMOS, and WMPL pipelines vs. the automatic reduction pipeline of FRIPON. The x-axis is the difference between the σv values processed by the DFN (a), AMOS (b), or WMPL (c) and those calculated by the FRIPON pipeline. The y-axis similarly shows the differences for the nominal vg values. |
5.2 Radiant and reference frames
The FRIPON astrometric pipeline is anchored to an inertial celestial frame. It uses the ICRF2/J2000 celestial reference frame for the star calibration (Colas et al. 2020). Stars from the Hippar-cos catalogue (an ICRF/J2000 reference) are matched in each camera field to determine orientation. In practice, FRIPON fits the camera model by converting the star coordinates from the celestial frame into the Earth-fixed frame (ITRF) at the time of observation (Jeanne et al. 2019). This implies that FRIPON does account for Earth’s rotation and precession when mapping star positions, that is, it essentially uses the star coordinates precessed to the observation epoch during calibration. The intent is to produce meteor directions in a J2000-equatorial frame for consistency (Colas et al. 2020). When the final radiant coordinates are not explicitly transformed back to the J2000 epoch, however, a slight epoch mismatch might remain. A difference of ∼20 years between the observation date and J2000 can shift the right ascension by about 0.3° due to precession. In other words, if FRIPON assumes its results are “in J2000” without actually rotating from the date-of-observation equinox, the RA would appear to be off by about 0.2°-0.3° (drifting 50.3 arcsec per year), exactly as observed. Thus, the FRIPON radiant output is effectively in the epoch of the event (or a recent epoch), whereas the other networks report J2000 coordinates. This leads to a systematic RA offset if not corrected for precession.
5.3 Velocity and uncertainties
The tendency of the FRIPON network to report higher meteoroid velocities likely results from its trajectory-fitting approach and deceleration model (Fig. 7). FRIPON employs a dynamic model of deceleration and mass loss, as described by Jeanne et al. (2019) (Eq. (2)), which describes the deceleration and ablation of a meteoroid in the atmosphere. In practice, the velocity solver overestimates Ve when the observed track shows insufficient resolved deceleration to constrain the deceleration model.
Jeanne (2020) (see pages 111-119 within) showed that in the weak-deceleration regime, the separation of Ve from A becomes ill conditioned, which slightly biases high Ve and inflates its formal uncertainty. In other words, many (Ve, A) pairs fit the luminous segment equally well. Moreover, when an object ablates away before any deceleration occurs, this can also result in an artificially high A value. In practice, for short, fast meteors that show very little deceleration, the fit therefore includes a fundamental ambiguity that can overestimate velocities and can be identified as a positive correlation between parameters A and Ve (see Jeanne (2020) pg. 117). Fig. 8 shows a clear correlation between these parameters by the FRIPON pipeline (Spearman ρ = 0.497, p = 1.5 × 10−36). Consequently, velocities for meteorite-dropping fireballs (which decelerate strongly) are expected to be more accurate, but the method is not optimal for low-deceleration impacts such as the Geminids examined here.
On the other hand, the lower velocities reported by the DFN pipeline (Fig. 7) are linked to lower-quality observations. As the number of observational data points decreases below 50 and the number of cameras is limited to 2, the DFN pipeline tends to produce slightly lower velocities than WMPL and AMOS. This is partially true for all the pipelines, but the DFN was designed for high-precision photographic observations, making it least equipped to handle noisier observations. This is exemplified by the fact that most of the Geminids analysed here (321 events) were only observed by two FRIPON cameras. If we had only considered events observed by more than three cameras, the vg estimations would start to converge (DFN: 33.7kms−1, WMPL: 33.7kms−1, FRIPON: 34.0kms−1, and AMOS: 33.8kms−1). The number of observations significantly affects the data quality of FRIPON events because the network was not designed with two-station detections in mind, but for meteorite-dropping events detected by multiple stations.
Pre-luminous atmospheric deceleration before the first observation can also significantly affect the velocity measurements of meteoroids before their visible ablation phase. Vida et al. (2018) demonstrated that the velocity measured at the start of the luminous trajectory is systematically lower than the true pre-atmospheric velocity. This underestimation is particularly significant for smaller or slower meteoroids, for which deceleration due to drag and ablation can result in discrepancies ranging from 100 to 750m s−1, depending on the meteoroid mass, composition, and initial velocity (Vida et al. 2018). This deceleration affects this particular observational dataset little, however, because over 98% of the meteoroids experienced a pre-luminous deceleration lower than 100 m s−1 (Fig. 2), with a median value of 25 ms−1. When this additional initial deceleration is taken into account by the DFN, AMOS, and WMPL (Fig. 1), the v∞ values change barely.
Even after pre-luminous deceleration is accounted for, all four data-reduction pipelines converge to a lower vg value than nearly all other reported values by the IAU MDC (top of Table 2). Systematic underestimation of Geminid speeds has been reported for several earlier video surveys (Hajduková Jr et al. 2017), mainly because these studies (i) centroided faint (mpeak ≳ +2) meteors and (ii) used straight-line fits that did not correct for deceleration. The four pipelines we used solve for the full dynamical state, and we accounted for pre-luminous corrections based on the model of Vida et al. (2018). The higher photographic speed value tabulated in the IAU-MDC derives almost exclusively from the smaller photographic set of Jopek et al. (2003), which is based on 1940-1950s Harvard plates, a handful of MORP observations (1971-1985), and 223 DMS observations (1972-1996). This produces a vg estimate that is ∼ 800 m s−1 faster than our results. More recent modern photographic fireball observations for equally large Geminids recorded by the European Fireball Network, however, produce a median vg = 34.1 km s−1 (Borovička et al. 2022b; Henych et al. 2024). A Kolmogorov-Smirnov test also confirmed that the difference with EN is significant (D = 0.38, p = 4.5 × 10⁻⁵). Thus, there is still a 250-300 m s−1 underestimate likely due to instrumental effects. Principally, as pointed out by Hajduková Jr et al. (2017), the automation of point-picking smeared-out motion-blurred meteor streaks can systematically affect the velocity estimates. In particular, this causes the speed to be underestimated when taking the centre of the streak, or overestimated when the leading edge is selected (Hajduková Jr et al. 2017). The 30 fps frame integration of FRIPON (33 ms) smears a Geminid by ∼1 km, and centroiding that streak shifts each pick slightly backwards along the path when the middle is selected. This probably accounts for the observed shift of 0.25 km s−1 relative to EN. In contrast, the much larger MDC discrepancy most likely reflects legacy calibration issues in the Harvard plates and not a genuine physical difference.
More notably, as illustrated in Fig. 6, although all four data-reduction pipelines provide generally similar spatial residual root mean square (RMS) values for the trajectory fits, there is a clear systematic trend in their estimated velocity uncertainties. The variation in the velocity uncertainty outcomes is striking: The WMPL pipeline yields the lowest uncertainties, followed by AMOS, FRIPON, and DFN, which reports the highest uncertainty estimates. This discrepancy is not due to poor model fits, as the RMS values for spatial residuals are comparable across all four pipelines at a population scale. Instead, the differences arise from varying methods in how each pipeline propagates and estimates uncertainties.
A factor that contributes to differences in the reported velocity uncertainties is the treatment of astrometric precision in each pipeline. The DFN pipeline alone takes astrometric uncertainties into account and propagates them to velocity models. These uncertainties are calculated for DFN images within the DFN image reduction. FRIPON does not output astrometric uncertainties, but Jeanne et al. (2019) noted that the FRIPON lens calibration routinely achieves ∼2 arcmin (1σ) residuals on astrometric measurements. As the DFN pipeline explicitly requires them (it requires columns err_minus_altitude, err_plus_altitude, err_minus_azimuth, err_plus_azimuth defined as optional in the astrometric standard of https://github.com/UKFAll/standard) to run FRIPON data through the DFN pipeline, we had to set default uncertainties for all observation points. We manually added values of 2 arcmin in azimuth and 4 arcmin in elevation to all observations. The inclusion of astrometric uncertainties has contributed to the systematically higher velocity uncertainties for the DFN results (Figure 6). A more likely factor is the way in which the EKS method is set up to handle the uncertainties while using a single-body model, however. As fragmentation is not explicitly modelled by the DFN pipeline, any abrupt deceleration manifests as additional process noise and is absorbed into the covariance matrix. Afterwards, the filter steps down the main-body mass and velocity (Sansom et al. 2015), resulting in increased overall uncertainties. It is designed to trust the observations over the model. When combined with the noisier data of FRIPON, an artificially inflated covariance matrix is triggered, which explains the apparent bimodal distribution in Figure 6. The lower σv cloud represents those in single-body mode, while the higher clouds use the fragmenting covariance matrix. The same two clusters appear within DFN data, which confirms that the uncertainty distribution is an intrinsic consequence of the EKS. Based on these two factors, the larger uncertainties presented here and the large cluster around 300-500ms−1 are a result of the low spatial resolution of the data and the high sampling rate of the FRIPON observations, which the EKS is not optimised to handle. While similarly high velocity uncertainties are estimated by the DFN pipeline for DFN observations, they typically constitute a minority subset.
The accuracy of uncertainties was also studied by Vida et al. (2020b), who reported that an underestimation of a factor of 2-4 occurs in the radiant uncertainty when 1-σ errors are used during the Monte Carlo procedure. This suggests that higher measurement errors should be introduced in the Monte Carlo procedure to ensure accurate uncertainty estimation. This analysis assumed that all sources of errors are random and not systematic, however. Vida et al. (2020b) demonstrated that systematic biases are also present due to the limitations of measurements (e.g. estimating the initial speed on a segment of the trajectory after some deceleration has already occurred). The problem therefore cannot be collapsed to a one-dimensional consideration of simply inflating the uncertainties. The same effect was also recently noted by Barghini et al. (2025), who defined an estimator R (with R ≈ 1 for realistic uncertainties and R > 1 when the uncertainties are underestimated) and measured R = 1.19 ± 0.05 for FRIPON, but R = 3.10 ± 0.02 for GMN and CAMS, indicating that the latter two databases publish velocity/radiant errors that are too small near the parabolic limit. This follows the long-noted link between surplus hyperbolic orbits and underestimated errors (e.g. Hajdukova et al. 2024), and it implies that while not the smallest, the FRIPON uncertainties are the most representative of the actual scatter in these observations. Between the four pipelines studied here, the results of Barghini et al. (2024) do not necessarily imply that the FRIPON pipeline uncertainties are the most representative, but they are less underestimated than the WMPL estimates according to this recent work.
This highlights a broader issue in the field: a clear disconnect between networks regarding how velocity uncertainties should be assessed. Achieving consensus on the propagation of uncertainty and accounting for various factors, such as systematics, timing, astrometric precision, and deceleration modelling, is essential for the standardised and reliable understanding of the meteoroid populations in near-Earth space.
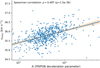 |
Fig. 8 FRIPON-derived entry speed ventry vs. the FRIPON deceleration parameter A (Jeanne et al. 2019; Colas et al. 2020). The solid line shows an ordinary least-squares fit, and the shaded band shows the 95% confidence interval. |
5.4 Advice for future meteor data creation and recommendations
Based on our work, we provide a handful of recommendations that we list below.
Researchers should be able to output/input observations in the GFE10 format so that the data can easily be shared, tested, and combined.
Per-event quality metadata in GFE should be included (e.g. station information, picks, convergence angle, minimum range, cross-track RMS, long-track RMS, frame rate, exposure, lens model, and clock source).
The single-station GFE files should be shared via Zenodo or some other file-sharing service.
All data processing pipelines should be publicly available on GitHub, Gitlab, and so on, with clear documentation.
Each network should clearly document the assumed celestial reference frame (e.g. “J2000 equatorial coordinates” or “noatmosphere topocentric horizontal coordinates”), detailing the reference epoch and refraction correction. All calculations (or final outputs) should be transformed into this frame at a precision of within an arcsecond.
It should be confirmed that the time stamps of each observatory, particularly shutter-opening times or frame midexposure times, are accurately and consistently converted into UTC, with verified leap seconds and known laten-cies/delays.
Per-pick astrometry and timing errors should be propagated through the trajectory and velocity fits, and the per-event 1σ uncertainties and propagation method should be reported (especially for automated point-picking).
The spectral sensitivity of the instrument should be specified and document the bandpass of the star catalogue used for photometric calibration and measurements should be documented.
Any idiosyncrasies of the instrument should be documented that will help to understand and reproduce the results.
When a group starts a meteor or fireball network, it is highly recommended to use WMPL11 to process the data. It is well written, publicly available, and well documented.
6 Testing a pipeline in comparison to ours
All FRIPON single-station observation files we used together with a summary table of the triangulation results for each data-reduction pipeline are available on Zenodo12.
For access to the pipelines we compared in this paper, WMPL is open-source software13. The DFN, FRIPON, and AMOS pipelines are currently being refactored to remove network-specific dependences and improve documentation, with the aim of making them publicly available. In the interim, the authors are happy to be contacted.
In this comparison, it is also vital to note that the per-station astrometry in the shared GFE files was only computed by the FRIPON pipeline. These GFE files, with FRIPON-reduced astrometry, were then used by the DFN, WMPL, and AMOS. Our cross-pipeline differences therefore reflect trajectory/velocity modelling and uncertainty propagation and not astrometric/timing calibration.
7 Conclusions
By reprocessing 584 FRIPON-observed Geminid fireballs with four independent data-reduction pipelines (FRIPON, DFN, WMPL, and AMOS), we found that the results of all pipelines are similar to those of previous studies, but the velocity and radiant coordinates differ slightly. The per-station astrometric solutions produced by FRIPON were used by the DFN, WMPL, and AMOS, and the cross-pipeline differences we discussed therefore do not arise from the astrometric processing. The FRIPON-retrieved velocities are about 0.2-0.4 km s−1 faster than those from DFN, WMPL, and AMOS. This overestimation is due to the deceleration-based model (Bronshtehn 1983) that is used to estimate velocities, which are not accurate when the deceleration is very low. The DFN, WMPL, and AMOS each employ more advanced velocity solvers, which produce similar results as long as the observations do not contain significant noise. Otherwise, when only two cameras observed the fireball or for fewer than 50 data points, the DFN tends to estimate slightly lower velocities than WMPL and AMOS. The FRIPON solutions for the radiant are systematically shifted by about −0.3° in right ascension relative to the other pipelines because of an epoch misalignment (no final precession to J2000), and this might be compounded by the older ITRF93 model used by FRIPON. This error is currently being remedied, and the FRIPON pipeline will in the future output correctly shifted J2000 radiants. All pipelines converge on orbital solutions that remain consistent with the known Geminid stream parameters. More than 99% of the fireballs retain a DN < 0.1 relative to the published Geminid observations.
A more pressing discrepancy emerges in the formal velocity uncertainties. Even though each pipeline generally fits the raw observations to the same degree (i.e. the RMS of the spatial residuals has a similar magnitude), the reported 1σ velocity uncertainties differ systematically, with WMPL reporting the lowest velocity uncertainties, followed by AMOS, FRIPON, and then DFN. These inconsistencies primarily reflect contrasting treatments of astrometric weighting, timing precision, and systematic effects and are not deficiencies in any single solver. Reliable orbital uncertainties are crucial for modelling meteoroid streams and linking meteors to their parent bodies. It is crucial to achieve a consensus on the uncertainty propagation for the community to address. Future work should focus on standardised approaches to specifying astrometric uncertainty, modelling pre-luminous deceleration, and automating outlier handling, thereby improving the consistency and interpretability across diverse meteor networks.
As meteor and fireball networks become more numerous due to the decreasing cost of precise sensors, along with the increased ubiquity of other observations from seismic, infrasound, radar, weather radar, telescopic, and satellite observations, our study represents the first step towards improving the collaboration between different networks and data sources. By combining more sensors and integrating increasingly diverse data-reduction methods, we anticipate that future studies will enable a more comprehensive understanding of meteoroid populations and their dynamics. In future work, we plan to conduct similar analyses for meteorite-dropping fireballs and pre-impact telescopic detections, such as the 2023 CX1 data because an external and independent estimate of the orbit would be extremely beneficial to the work.
Acknowledgements
This project received funding from the European Union’s Horizon 2020 research and innovation programme under the Marie Sklodowska-Curie grant agreement No. 945298 ParisRegionFP (P.M.S.), and the grant agreement No. 101150536 (S.A.) The Global Fireball Observatory and data pipeline is enabled by the support of the Australian Research Council (DP230100301, LE170100106). FRIPON was initiated by funding from ANR (grant No. 13-BS05-0009-03), carried by the Paris Observatory, Muséum National d’Histoire Naturelle, Paris-Saclay University and Institut Pythéas (LAM-CEREGE). VigieCiel was part of the 65 Millions d’Observateurs project, carried by the Muséum National d’Histoire Naturelle and funded by the French Investissements d’Avenir program. FRIPON data are hosted and processed at Institut Pythéas SIP (Service Informatique Pythéas), and a mirror is hosted at LTE (Le Laboratoire Temps Espace/Paris Observatory). This project was partially funded by the Excellent Grant of Comenius University no. UK/3055/2024 (Flux of primitive and differentiated material to Earth). This work was also supported by the Slovak Grant Agency for Science (grant VEGA 1/0218/22), and by the Slovak Research and Development Agency grants APVV-23-0323 and VV-MVP-24-0232. The authors would also like to thank Simon Jeanne for his communication and help in interpreting some of the results. Also, we would like to thank the anonymous reviewer whose thorough analysis and recommendations greatly improved the manuscript.
References
- Anderson, S. L., Towner, M. C., Fairweather, J., et al. 2022, ApJ, 930, L25 [Google Scholar]
- Anghel, S., Birlan, M., Nedelcu, D.-A., & Boaca, I. 2019, RoAJ, 29, 191 [NASA ADS] [Google Scholar]
- Anghel, S., Drolshagen, E., Ott, T., et al. 2021, MNRAS, 508, 5716 [Google Scholar]
- Anghel, S., Nedelcu, D. A., Birlan, M., & Boaca, I. 2023, MNRAS, 518, 2810 [Google Scholar]
- Antier, K. 2023, Bolide du 10 septembre, 00H13 [Google Scholar]
- Arlt, R., Asher, D. J., Brown, P. G., et al. 2022, Handbook for Meteor Observers, ed. J. Rendtel (International Meteor Organization) [Google Scholar]
- Barghini, D., Carbognani, A., Gardiol, D., et al. 2024, in XIX Congresso Nazionale di Scienze Planetarie, Società Italiana di Scienze Planetarie [Google Scholar]
- Barghini, D., Ďurišová, S., Koten, P., et al. 2025, A&A, 701, A135 [NASA ADS] [CrossRef] [EDP Sciences] [Google Scholar]
- Bessell, M. S. 2000, Publ. Astron. Soc. Pac., 112, 961 [NASA ADS] [CrossRef] [Google Scholar]
- Bland, P. A., Spurny, P., Towner, M. C., et al. 2009, Science, 325, 1525 [CrossRef] [Google Scholar]
- Bland, P., Spurný, P., Bevan, A., et al. 2012, Aust. J. Earth Sci., 59, 177 [Google Scholar]
- Borovička, J. 1990, Bull. Astr. Inst. Czechosl., 41, 391 [NASA ADS] [Google Scholar]
- Borovička, J., & Kalenda, P. 2003, Meteorit. Planet. Sci., 38, 1023 [Google Scholar]
- Borovička, J., Spurny, P., & Keclikova, J. 1995, A&AS, 112, 173 [Google Scholar]
- Borovička, J., Spurný, P., & Koten, P. 2007, A&A, 473, 661 [NASA ADS] [CrossRef] [EDP Sciences] [Google Scholar]
- Borovička, J., Tóth, J., Igaz, A., et al. 2013, Meteorit. Planet. Sci., 48, 1757 [Google Scholar]
- Borovička, J., Shrbený, P., & Shrbený, L. 2020, AJ, 160, 42 [CrossRef] [Google Scholar]
- Borovička, J., Shrbený, P., & Shrbený, L. 2022a, A&A, 667, A158 [NASA ADS] [CrossRef] [EDP Sciences] [Google Scholar]
- Borovička, J., Shrbený, P., Shrbený, L., et al. 2022b, A&A, 667, A157 [NASA ADS] [CrossRef] [EDP Sciences] [Google Scholar]
- Bronshtehn, V. A. 1983, Physics of meteor phenomena [Google Scholar]
- Brown, P., Weryk, R., Wong, D., & Jones, J. 2008, Icarus, 195, 317 [NASA ADS] [CrossRef] [Google Scholar]
- Brown, P., Weryk, R., Kohut, S., Edwards, W., & Krzeminski, Z. 2010a, WGN, 38, 25 [Google Scholar]
- Brown, P., Wong, D., Weryk, R., & Wiegert, P. 2010b, Icarus, 207, 66 [NASA ADS] [CrossRef] [Google Scholar]
- Brown, P. G., McCausland, P., Hildebrand, A., et al. 2023, Meteorit. Planet. Sci., 58, 1773 [Google Scholar]
- Campbell-Burns, P., & Kacerek, R. 2014, WGN, 42, 139 [Google Scholar]
- Ceplecha, Z. 1961, Bull. Astr. Inst. Czechosl., 12, 21 [Google Scholar]
- Ceplecha, Z. 1987, Bull. Astr. Inst. Czechosl., 38, 222 [Google Scholar]
- Ceplecha, Z., Spurny, P., Borovička, J., & Keclikova, J. 1993, A&A, 279, 615 [Google Scholar]
- Ceplecha, Z., Borovička, J., Elford, W. G., et al. 1998, Space Sci. Rev., 84, 327 [NASA ADS] [CrossRef] [Google Scholar]
- Colas, F., Zanda, B., Bouley, S., et al. 2020, A&A, 644, A53 [EDP Sciences] [Google Scholar]
- Cooke, W. J., & Moser, D. E. 2012, in Proceedings of the International Meteor Conference, 30th IMC, Sibiu, Romania, 2011, 9 [Google Scholar]
- Devillepoix, H. A., Sansom, E. K., Bland, P. A., et al. 2018, Meteorit. Planet. Sci., 53, 2212 [Google Scholar]
- Devillepoix, H. A., Bland, P. A., Sansom, E. K., et al. 2019, MNRAS, 483, 5166 [NASA ADS] [CrossRef] [Google Scholar]
- Devillepoix, H., Cupak, M., Bland, P., et al. 2020, Planet. Space Sci., 191, 105036 [Google Scholar]
- Devillepoix, H. A. R., Sansom, E. K., Shober, P., et al. 2022, Meteorit. Planet. Sci., 57, 1328 [Google Scholar]
- Drummond, J. D. 1981, Icarus, 45, 545 [NASA ADS] [CrossRef] [Google Scholar]
- Duris, F., Kornos, L., & Toth, J. 2018, in Proceedings of the International Meteor Conference, 37th IMC, Pezinok-Modra, Slovakia, 2018, eds. R. Rudawska, J. Rendtel, C. Powell, R. Lunsford, C. Verbeeck, & A. Knofel, 127 [Google Scholar]
- Dyl, K. A., Benedix, G. K., Bland, P. A., et al. 2016, Meteor. Planet. Sci., 51, 596 [Google Scholar]
- Egal, A., Gural, P., Vaubaillon, J., Colas, F., & Thuillot, W. 2017, Icarus, 294, 43 [NASA ADS] [CrossRef] [Google Scholar]
- Egal, A., Vida, D., Colas, F., et al. 2025, Nat. Astron., 9, 1624 [Google Scholar]
- Gardiol, D., Barghini, D., Buzzoni, A., et al. 2021, MNRAS, 501, 1215 [Google Scholar]
- Granvik, M., Morbidelli, A., Jedicke, R., et al. 2018, Icarus, 312, 181 [CrossRef] [Google Scholar]
- Gritsevich, M. 2009, Adv. Space Res., 44, 323 [NASA ADS] [CrossRef] [Google Scholar]
- Gural, P., & Segon, D. 2009, WGN, 37, 28 [Google Scholar]
- Gural, P. S. 2011, in Proceedings of the International Meteor Conference, 29th IMC, Armagh, Northern Ireland, 2010, 28 [Google Scholar]
- Gural, P. S. 2012, Meteorit. Planet. Sci., 47, 1405 [NASA ADS] [CrossRef] [Google Scholar]
- Hajdukova, M., Stober, G., Barghini, D., et al. 2024, A&A, 691, A8 [NASA ADS] [CrossRef] [EDP Sciences] [Google Scholar]
- Hajduková Jr, M., Koten, P., Kornoš, L., & Tóth, J. 2017, Planet. Space Sci., 143, 89 [CrossRef] [Google Scholar]
- Halliday, I., Blackwell, A. T., & Griffin, A. A. 1978, JRASC, 72, 15 [Google Scholar]
- Hankey, M., Perlerin, V., & Meisel, D. 2020, Planet. Space Sci., 190, 105005 [CrossRef] [Google Scholar]
- Henych, T., Borovička, J., Vojáček, V., & Spurny, P. 2024, A&A, 683, A229 [NASA ADS] [CrossRef] [EDP Sciences] [Google Scholar]
- Howie, R. M., Paxman, J., Bland, P. A., et al. 2017a, Exp. Astron., 43, 237 [Google Scholar]
- Howie, R. M., Paxman, J., Bland, P. A., et al. 2017b, Meteorit. Planet. Sci., 52, 1669 [Google Scholar]
- Jansen-Sturgeon, T., Sansom, E. K., Devillepoix, H. A., et al. 2020, AJ, 160, 190 [Google Scholar]
- Jeanne, S. 2020, PhD thesis, Université Paris Sciences et Lettres [Google Scholar]
- Jeanne, S., Colas, F., Zanda, B., et al. 2019, A&A, 627, A78 [EDP Sciences] [Google Scholar]
- Jenniskens, P. 2008, Icarus, 194, 13 [NASA ADS] [CrossRef] [Google Scholar]
- Jenniskens, P., Gural, P., Dynneson, L., et al. 2011, Icarus, 216, 40 [NASA ADS] [CrossRef] [Google Scholar]
- Jenniskens, P., Nénon, Q., Albers, J., et al. 2016, Icarus, 266, 331 [NASA ADS] [CrossRef] [Google Scholar]
- Jenniskens, P., Utas, J., Yin, Q.-Z., et al. 2019, Meteorit. Planet. Sci., 54, 699 [Google Scholar]
- Jopek, T. J. 1993, Icarus, 106, 603 [NASA ADS] [CrossRef] [Google Scholar]
- Jopek, T., Valsecchi, G., & Froeschlé, C. 2003, MNRAS, 344, 665 [NASA ADS] [CrossRef] [Google Scholar]
- Jopek, T. J., Rudawska, R., & Bartczak, P. 2008, Adv. Meteoroid Meteor. Sci., 73 [Google Scholar]
- King, A. J., Daly, L., Rowe, J., et al. 2022, Sci. Adv., 8, eabq3925 [CrossRef] [Google Scholar]
- Koten, P., Rendtel, J., Shrbený, L., et al. 2019, Meteoroids: Sources of Meteors on Earth and Beyond, 90 [Google Scholar]
- Kresák, L., & Porubcan, V. 1970, Bull. Astr. Inst. Czechosl., 21, 153 [Google Scholar]
- Lyytinen, E., & Gritsevich, M. 2016, Planet. Space Sci., 120, 35 [Google Scholar]
- Matlovic, P., Tóth, J., Rudawska, R., Kornoš, L., & Pisarčíková, A. 2019, A&A, 629, A71 [NASA ADS] [CrossRef] [EDP Sciences] [Google Scholar]
- Matlovic, P., Kornoš, L., Kováčová, M., Tóth, J., & Licandro, J. 2020, A&A, 636, A122 [NASA ADS] [CrossRef] [EDP Sciences] [Google Scholar]
- Matlovič, P., Pisarčíková, A., Tóth, J., et al. 2022, MNRAS, 513, 3982 [CrossRef] [Google Scholar]
- McCrosky, R. E., Posen, A., Schwartz, G., & Shao, C.-Y. 1971, J. Geophys. Res., 76, 4090 [Google Scholar]
- McMullan, S., Vida, D., Devillepoix, H. A., et al. 2023, Meteorit. Planet. Sci., 59, 927 [Google Scholar]
- Molau, S. 1999, in Proceedings of the International Meteor Conference, 17th IMC, Stara Lesna, Slovakia, 1998, 9 [Google Scholar]
- Molau, S. 2001, in Meteoroids 2001 Conference, 495, 315 [Google Scholar]
- Moorhead, A. V., Clements, T., & Vida, D. 2021, MNRAS, 508, 326 [NASA ADS] [CrossRef] [Google Scholar]
- Peña-Asensio, E., Trigo-Rodríguez, J. M., Gritsevich, M., & Rimola, A. 2021, MNRAS, 504, 4829 [Google Scholar]
- Rowe, J. 2021, WGN, 49, 211 [Google Scholar]
- Sansom, E. K., Bland, P., Paxman, J., & Towner, M. 2015, Meteorit. Planet. Sci., 50, 1423 [Google Scholar]
- Sansom, E. K., Bland, P. A., Towner, M. C., et al. 2020, Meteorit. Planet. Sci., 55, 2157 [Google Scholar]
- Sansom, E. K., Gritsevich, M., Devillepoix, H. A., et al. 2019a, ApJ, 885, 115 [Google Scholar]
- Sansom, E. K., Jansen-Sturgeon, T., Rutten, M. G., et al. 2019b, Icarus, 321, 388 [Google Scholar]
- Shober, P. M., & Vaubaillon, J. 2024, A&A, 686, A130 [NASA ADS] [CrossRef] [EDP Sciences] [Google Scholar]
- Shober, P. M., Jansen-Sturgeon, T., Sansom, E. K., et al. 2020, AJ, 159, 191 [Google Scholar]
- Shober, P. M., Sansom, E. K., Bland, P. A., et al. 2021, PSJ, 2, 98 [NASA ADS] [Google Scholar]
- Shober, P. M., Devillepoix, H. A., Sansom, E. K., et al. 2022, Meteorit. Planet. Sci., 57, 1146 [Google Scholar]
- Shober, P. M., Devillepoix, H. A., Vaubaillon, J., et al. 2025, Nat. Astron., 9, 799 [Google Scholar]
- SonotaCo, A. 2009, WGN, 37, 55 [Google Scholar]
- Southworth, R., & Hawkins, G. 1963, Smithsonian Contr. Astrophys., 7, 261 [Google Scholar]
- Spurny, P., Borovička, J., & Shrbený, L. 2006, Proc. Int. Astron. Union, 2, 121 [Google Scholar]
- Stulov, V., Mirskii, V., & Vislyi, A. 1995, Moscow: Science. Fizmatlit [Google Scholar]
- Suk, T., & Simberová, S. 2017, Earth Moon Planets, 120, 189 [Google Scholar]
- Tóth, J., Kornoš, L., Zigo, P., et al. 2015, Planet. Space Sci., 118, 102 [CrossRef] [Google Scholar]
- Tóth, J., Silha, J., Matlovic, P., et al. 2019, in 1st NEO and Debris Detection Conference_ESA2019, 63 [Google Scholar]
- Trigo-Rodríguez, J. M., Llorca, J., Castro-Tirado, A. J., et al. 2006, A&G, 47, 6 [Google Scholar]
- Turchak, L. I., & Gritsevich, M. I. 2014, J. Theor. Appl. Mech., 44, 15 [Google Scholar]
- Valsecchi, G., Jopek, T., & Froeschlé, C. 1999, MNRAS, 304, 743 [NASA ADS] [CrossRef] [Google Scholar]
- Vida, D., Brown, P. G., & Campbell-Brown, M. 2018, MNRAS, 479, 4307 [NASA ADS] [CrossRef] [Google Scholar]
- Vida, D., Campbell-Brown, M., Brown, P. G., Egal, A., & Mazur, M. J. 2020a, A&A, 635, A153 [NASA ADS] [CrossRef] [EDP Sciences] [Google Scholar]
- Vida, D., Gural, P. S., Brown, P. G., Campbell-Brown, M., & Wiegert, P. 2020b, MNRAS, 491, 2688 [NASA ADS] [CrossRef] [Google Scholar]
- Vida, D., Šegon, D., Gural, P. S., et al. 2021, MNRAS, 506, 5046 [NASA ADS] [CrossRef] [Google Scholar]
- Vida, D., Brown, P. G., Devillepoix, H. A., et al. 2023, Nat. Astron., 7, 318 [Google Scholar]
- Vida, D., Brown, P. G., Campbell-Brown, M., & Egal, A. 2024, Icarus, 408, 115842 [Google Scholar]
- Weryk, R., Campbell-Brown, M., Wiegert, P., et al. 2013, Icarus, 225, 614 [Google Scholar]
- Wisniewski, M., Żołądek, P., Olech, A., et al. 2017, Planet. Space Sci., 143, 12 [NASA ADS] [CrossRef] [Google Scholar]
- Zanda, B., Égal, A., Steinhausser, A., et al. 2023, in 86th Annual Meeting of the Meteoritical Society [Google Scholar]
WMPL library on GitHub: https://github.com/wmpg/WesternMeteorPyLib (accessed July 10, 2024).
RMS library on GitHub: https://github.com/CroatianMeteorNetwork/RMS (accessed July 10, 2024).
Appendix A Pipeline-comparison matrix plots
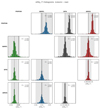 |
Fig. A.1 ΔRA histograms (column - row) for all pairwise combinations of FRIPON, WMPL, DFN, and AMOS. The solid vertical line denotes zero, the dashed vertical line indicates the median, and the grey region encompasses the 95% confidence region. Δ is the median value, and the ± indicates half of the 95% region. |
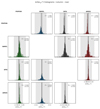 |
Fig. A.2 ΔDec histograms (column - row) for all pairwise combinations of FRIPON, WMPL, DFN, and AMOS. The solid vertical line denotes zero, the dashed vertical line indicates the median, and the grey region encompasses the 95% confidence region. Δ is the median value, and the ± indicates half of the 95% region. |
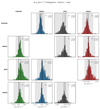 |
Fig. A.3 Δvg histograms (column - row) for all pairwise combinations of FRIPON, WMPL, DFN, and AMOS. The solid vertical line denotes zero, the dashed vertical line indicates the median, and the grey region encompasses the 95% confidence region. Δ is the median value, and the ± indicates half of the 95% region. |
 |
Fig. A.4 Δa histograms (column - row) for all pairwise combinations of FRIPON, WMPL, DFN, and AMOS. The solid vertical line denotes zero, the dashed vertical line indicates the median, and the grey region encompasses the 95% confidence region. Δ is the median value, and the ± indicates half of the 95% region. |
 |
Fig. A.5 Δe histograms (column - row) for all pairwise combinations of FRIPON, WMPL, DFN, and AMOS. The solid vertical line denotes zero, the dashed vertical line indicates the median, and the grey region encompasses the 95% confidence region. Δ is the median value, and the ± indicates half of the 95% region. |
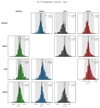 |
Fig. A.6 Δi histograms (column - row) for all pairwise combinations of FRIPON, WMPL, DFN, and AMOS. The solid vertical line denotes zero, the dashed vertical line indicates the median, and the grey region encompasses the 95% confidence region. Δ is the median value, and the ± indicates half of the 95% region. |
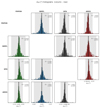 |
Fig. A.7 Δω histograms (column - row) for all pairwise combinations of FRIPON, WMPL, DFN, and AMOS. The solid vertical line denotes zero, the dashed vertical line indicates the median, and the grey region encompasses the 95% confidence region. Δ is the median value, and the ± indicates half of the 95% region. |
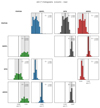 |
Fig. A.8 ΔΩ histograms (column - row) for all pairwise combinations of FRIPON, WMPL, DFN, and AMOS. The solid vertical line denotes zero, the dashed vertical line indicates the median, and the grey region encompasses the 95% confidence region. Δ is the median value, and the ± indicates half of the 95% region. |
All Tables
One-sigma single radiant measurement uncertainties for the FRIPON Geminid sample.
All Figures
|
Fig. 1 Distribution of v∞ corrected for pre-luminous deceleration using the model of Vida et al. (2018). The dashed vertical line and corresponding value correspond to the median v∞. |
| In the text | |
|
Fig. 2 Pre-luminous deceleration estimated for the 584 Geminid FRIPON fireballs using the model of Vida et al. (2018), showing that >98% experienced a deceleration lower than 100 m/s before detection. The dashed vertical line indicates the median value. |
| In the text | |
|
Fig. 3 Calculated geocentric radiant distribution for the Geminid meteor showers based on FRIPON observations between 2016-2023. The six black points with crosses indicate radiants identified from previous studies of the Geminids (A: Jopek et al. 2003, B: Brown et al. 2008, C: SonotaCo 2009, D: Brown et al. 2010b, E: Jenniskens et al. 2016). The nominal values for the four pipelines and previous results can also be found in Table 2. |
| In the text | |
|
Fig. 4 Variation in the FRIPON-observed Geminid fireball radiants calculated by the DFN, AMOS, and WMPL data-reduction pipelines relative to those calculated by the FRIPON automated pipeline. |
| In the text | |
|
Fig. 5 Median 1σ radiant uncertainties in (top) right ascension and (bottom) declination as a function of the trajectory-fit cross-track RMS residuals. The values are binned logarithmically in RMS. the solid line in each colour-coded curve shows the median of all events in the bin, and the shaded region encloses the 5-95% percentile range (central 90%) and illustrates the event-to-event spread. |
| In the text | |
|
Fig. 6 Variation in the RMS of the cross-track spatial residuals (m) for the trajectory fitting vs. the velocity uncertainty estimated by each pipeline. The vertical dashed lines indicate the median value. All pipelines have relatively equal RMS ranges, but the velocity uncertainties differ systematically. |
| In the text | |
|
Fig. 7 Comparison of the velocity and velocity uncertainty of Gemi-nid meteor shower FRIPON events processed by the DFN, AMOS, and WMPL pipelines vs. the automatic reduction pipeline of FRIPON. The x-axis is the difference between the σv values processed by the DFN (a), AMOS (b), or WMPL (c) and those calculated by the FRIPON pipeline. The y-axis similarly shows the differences for the nominal vg values. |
| In the text | |
|
Fig. 8 FRIPON-derived entry speed ventry vs. the FRIPON deceleration parameter A (Jeanne et al. 2019; Colas et al. 2020). The solid line shows an ordinary least-squares fit, and the shaded band shows the 95% confidence interval. |
| In the text | |
|
Fig. A.1 ΔRA histograms (column - row) for all pairwise combinations of FRIPON, WMPL, DFN, and AMOS. The solid vertical line denotes zero, the dashed vertical line indicates the median, and the grey region encompasses the 95% confidence region. Δ is the median value, and the ± indicates half of the 95% region. |
| In the text | |
|
Fig. A.2 ΔDec histograms (column - row) for all pairwise combinations of FRIPON, WMPL, DFN, and AMOS. The solid vertical line denotes zero, the dashed vertical line indicates the median, and the grey region encompasses the 95% confidence region. Δ is the median value, and the ± indicates half of the 95% region. |
| In the text | |
|
Fig. A.3 Δvg histograms (column - row) for all pairwise combinations of FRIPON, WMPL, DFN, and AMOS. The solid vertical line denotes zero, the dashed vertical line indicates the median, and the grey region encompasses the 95% confidence region. Δ is the median value, and the ± indicates half of the 95% region. |
| In the text | |
|
Fig. A.4 Δa histograms (column - row) for all pairwise combinations of FRIPON, WMPL, DFN, and AMOS. The solid vertical line denotes zero, the dashed vertical line indicates the median, and the grey region encompasses the 95% confidence region. Δ is the median value, and the ± indicates half of the 95% region. |
| In the text | |
|
Fig. A.5 Δe histograms (column - row) for all pairwise combinations of FRIPON, WMPL, DFN, and AMOS. The solid vertical line denotes zero, the dashed vertical line indicates the median, and the grey region encompasses the 95% confidence region. Δ is the median value, and the ± indicates half of the 95% region. |
| In the text | |
|
Fig. A.6 Δi histograms (column - row) for all pairwise combinations of FRIPON, WMPL, DFN, and AMOS. The solid vertical line denotes zero, the dashed vertical line indicates the median, and the grey region encompasses the 95% confidence region. Δ is the median value, and the ± indicates half of the 95% region. |
| In the text | |
|
Fig. A.7 Δω histograms (column - row) for all pairwise combinations of FRIPON, WMPL, DFN, and AMOS. The solid vertical line denotes zero, the dashed vertical line indicates the median, and the grey region encompasses the 95% confidence region. Δ is the median value, and the ± indicates half of the 95% region. |
| In the text | |
|
Fig. A.8 ΔΩ histograms (column - row) for all pairwise combinations of FRIPON, WMPL, DFN, and AMOS. The solid vertical line denotes zero, the dashed vertical line indicates the median, and the grey region encompasses the 95% confidence region. Δ is the median value, and the ± indicates half of the 95% region. |
| In the text | |
Current usage metrics show cumulative count of Article Views (full-text article views including HTML views, PDF and ePub downloads, according to the available data) and Abstracts Views on Vision4Press platform.
Data correspond to usage on the plateform after 2015. The current usage metrics is available 48-96 hours after online publication and is updated daily on week days.
Initial download of the metrics may take a while.