Open Access
Fig. 6
Download original image
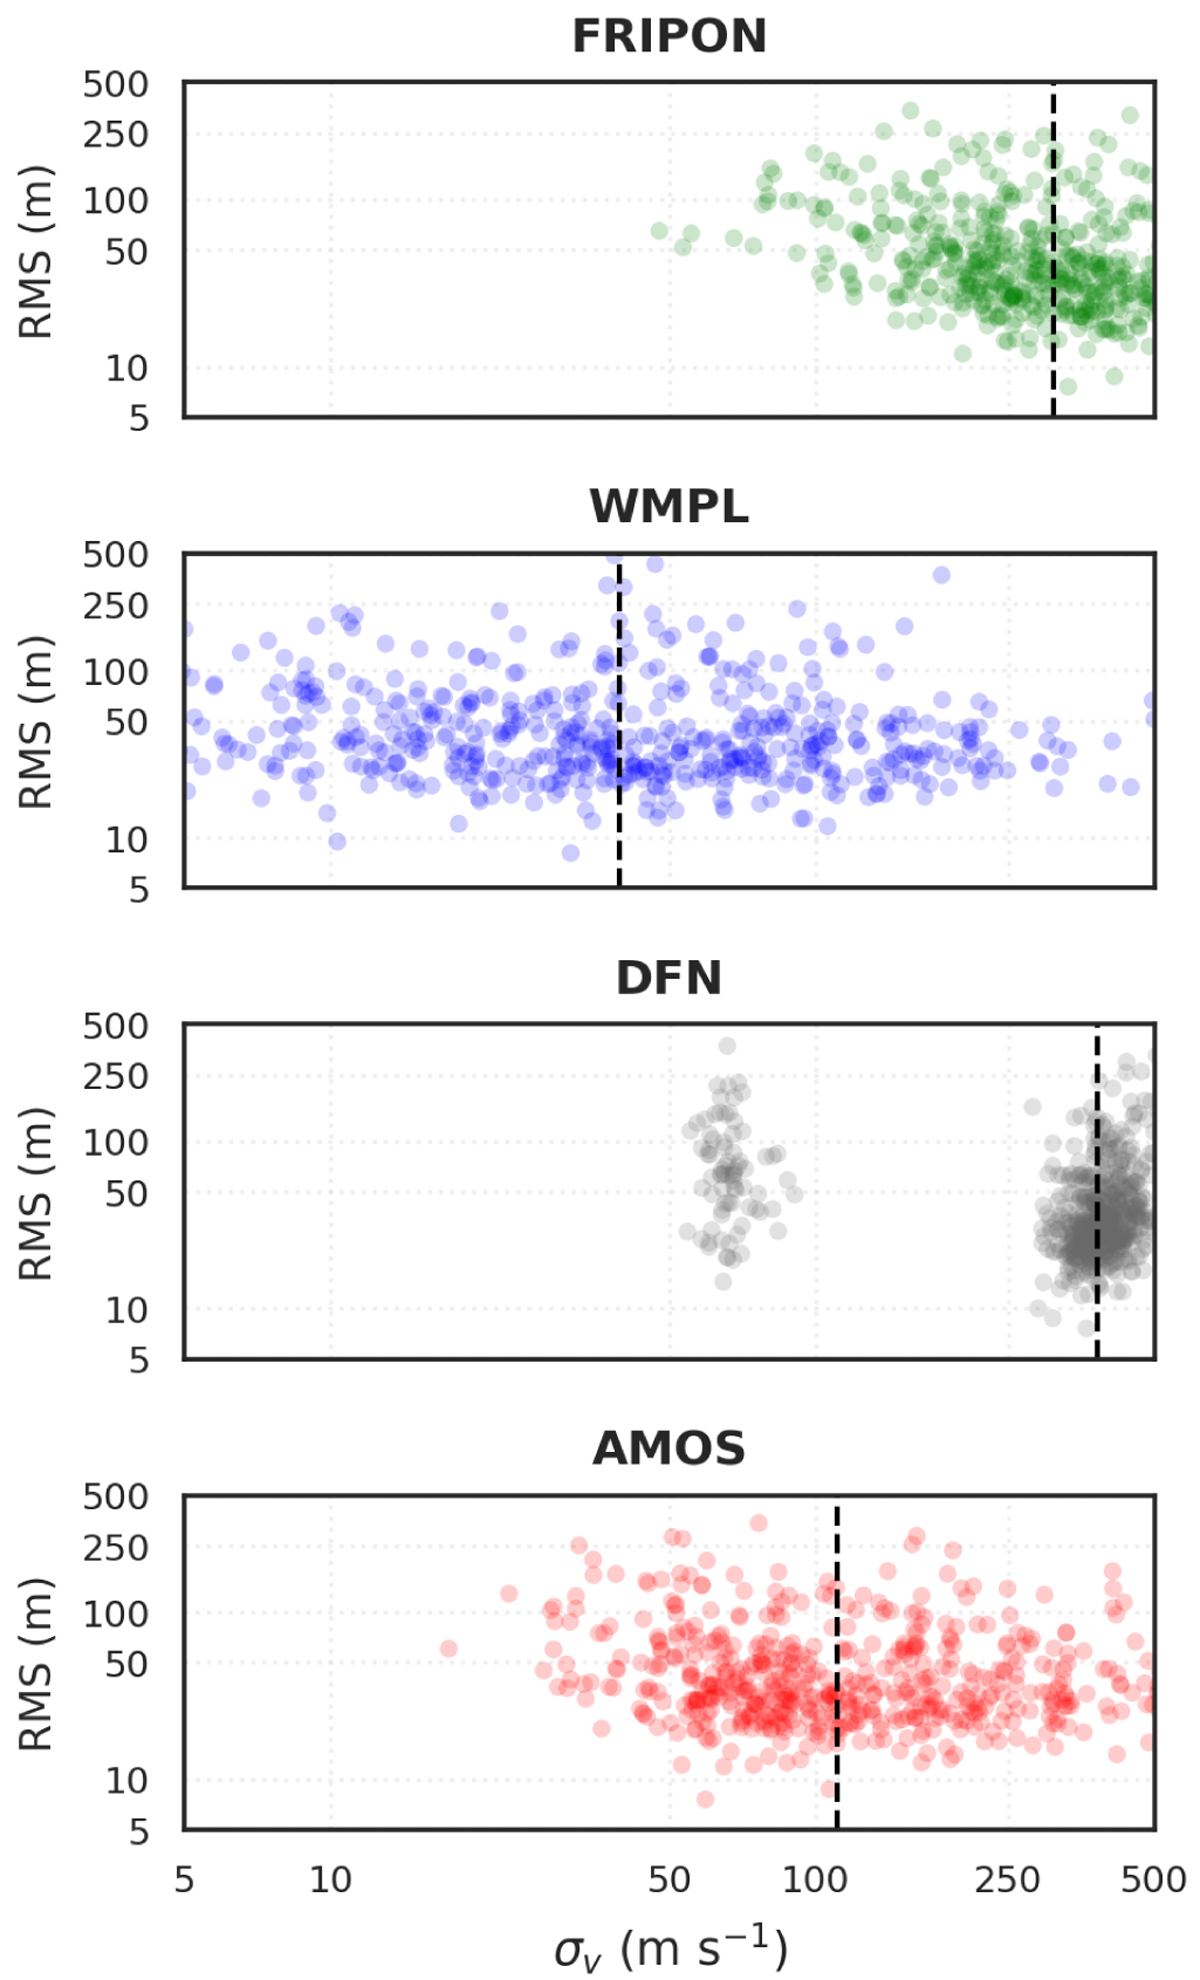
Variation in the RMS of the cross-track spatial residuals (m) for the trajectory fitting vs. the velocity uncertainty estimated by each pipeline. The vertical dashed lines indicate the median value. All pipelines have relatively equal RMS ranges, but the velocity uncertainties differ systematically.
Current usage metrics show cumulative count of Article Views (full-text article views including HTML views, PDF and ePub downloads, according to the available data) and Abstracts Views on Vision4Press platform.
Data correspond to usage on the plateform after 2015. The current usage metrics is available 48-96 hours after online publication and is updated daily on week days.
Initial download of the metrics may take a while.