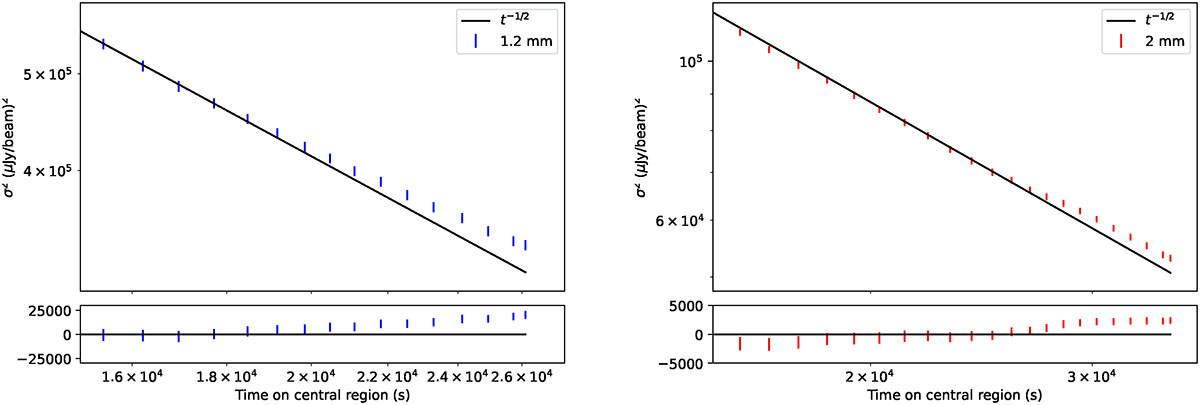
Fig. 2.
Download original image
Variance of the N2CLS maps vs. the out of atmosphere integration time on a region in the center equivalent to one NIKA2 field of view (6.5 arcmin diameter). To determine these data points, we simply take the variance of the unmasked pixels (see Fig. 1) in the central area. For each NIKA2 band, the lower plot shows the residuals compared to the t−1/2 instrumental noise integration that is fitted here for times of integration smaller than 20 000 s. The error bars are the square roots of the diagonal elements of the covariance matrix of the measures (Fig. A.2), derived from 100 Monte-Carlo simulations of map-based realistic noise (per scan). There is a clear excess of signal at high integration time due to the confusion, but as explained in the main text, this plot is for illustrative purposes only and is not used to derive our final results.
Current usage metrics show cumulative count of Article Views (full-text article views including HTML views, PDF and ePub downloads, according to the available data) and Abstracts Views on Vision4Press platform.
Data correspond to usage on the plateform after 2015. The current usage metrics is available 48-96 hours after online publication and is updated daily on week days.
Initial download of the metrics may take a while.