Fig. 3.
Download original image
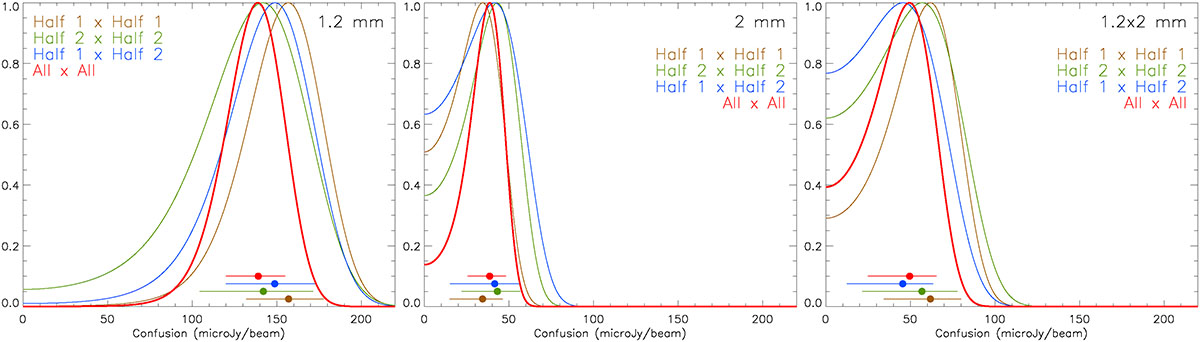
Likelihoods (normalised to their maximum) of the confusion at 1 mm, 2 mm, and the cross-confusion 1 × 2 mm for different subsets of our data. The central points and their 1-σ equivalent error bars are shown for convenience and have arbitrary ordinates. ‘Half 1’ refers to scans oriented at 40°. ‘Half 2’ refers to scans oriented at −50°. ‘All’ refers to the total sum of the two.
Current usage metrics show cumulative count of Article Views (full-text article views including HTML views, PDF and ePub downloads, according to the available data) and Abstracts Views on Vision4Press platform.
Data correspond to usage on the plateform after 2015. The current usage metrics is available 48-96 hours after online publication and is updated daily on week days.
Initial download of the metrics may take a while.