Fig. 4.
Download original image
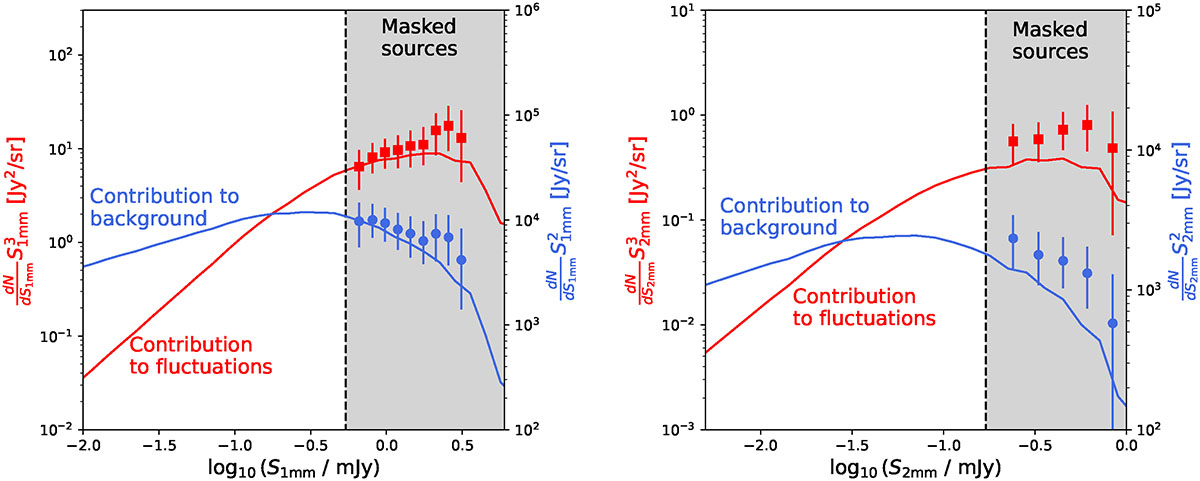
Relative contribution to the background (blue curve) and to the fluctuations causing the confusion (red curve) as a function of the flux density derived with the SIDES simulation at 1.2 mm (left) and 2 mm (right) (see Sect. 5). The same quantities derived from the source counts measurements in GOODS-N by Bing et al. (2023) are shown as blue circles and red squares, respectively. The difference between the prediction of galaxy counts from SIDES and the source counts from N2CLS is well understood and caused by the blending of galaxies into the NIKA2 beam (see the analysis in Bing et al. 2023). The grey area shows the flux density regime where the sources are masked and do not contribute to the confusion.
Current usage metrics show cumulative count of Article Views (full-text article views including HTML views, PDF and ePub downloads, according to the available data) and Abstracts Views on Vision4Press platform.
Data correspond to usage on the plateform after 2015. The current usage metrics is available 48-96 hours after online publication and is updated daily on week days.
Initial download of the metrics may take a while.