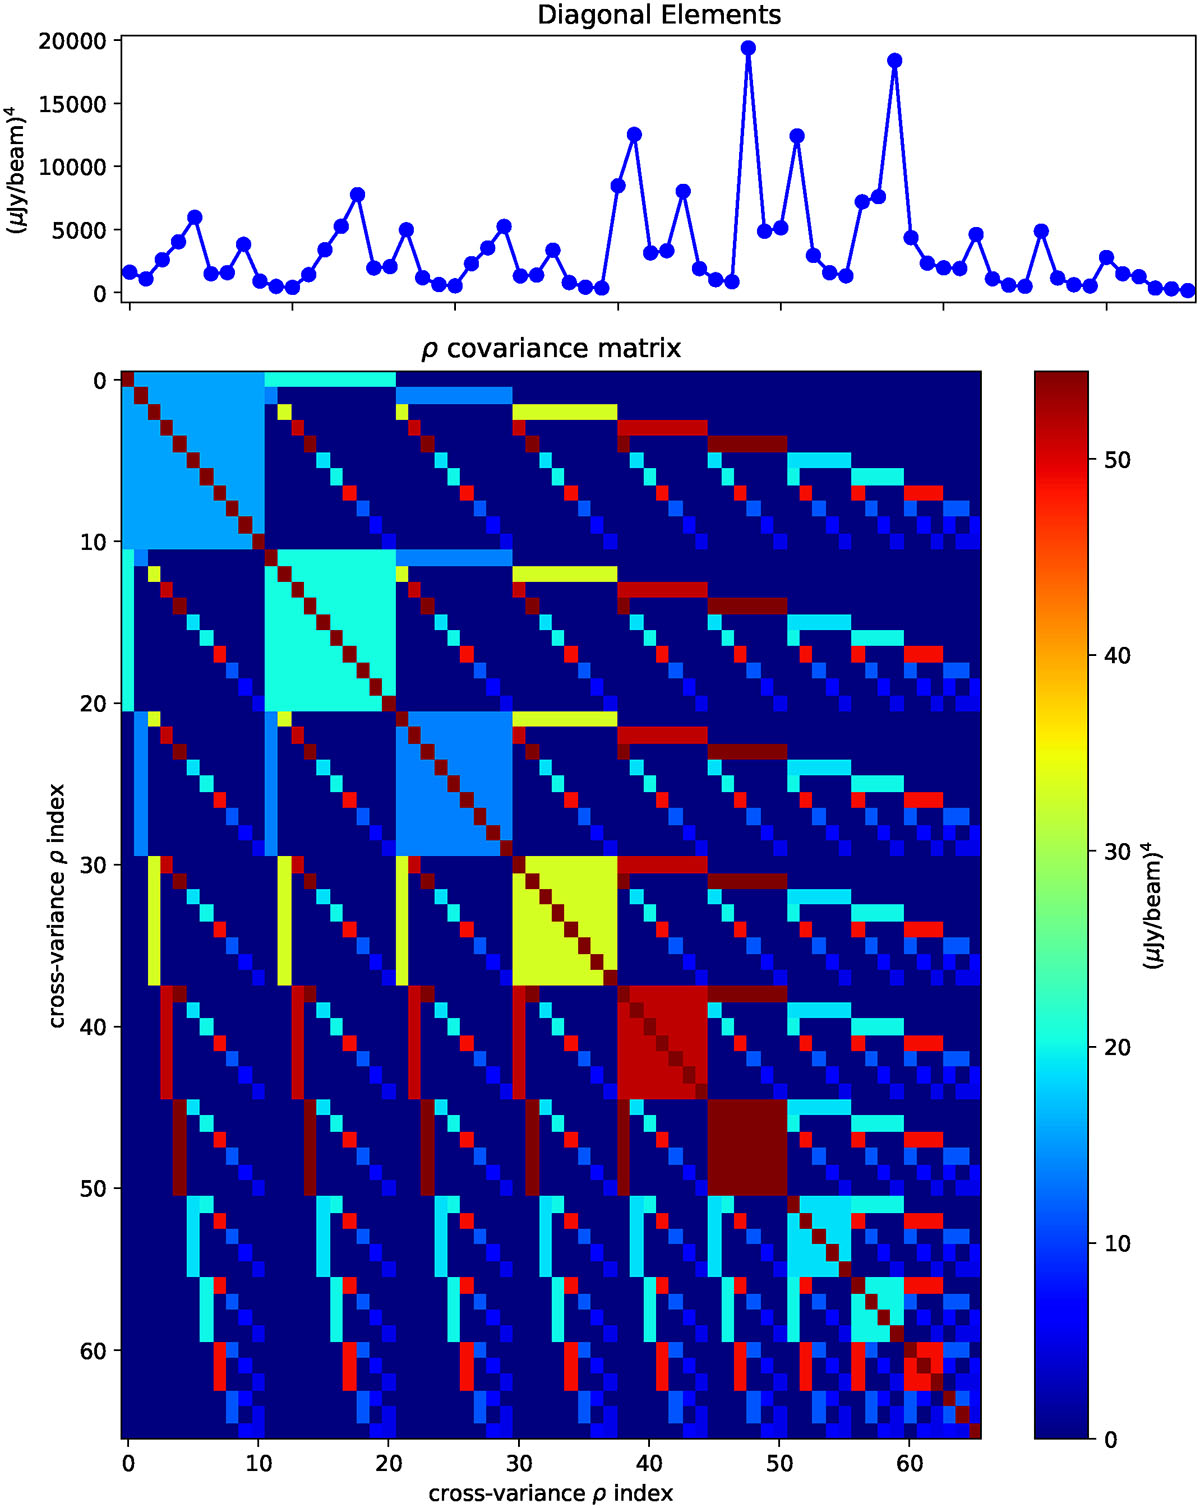
Fig. A.2.
Download original image
Covariance matrix of the 66 cross-variance estimates. Each pixel of this image is an element of this 66 × 66 matrix, and its value is given by the color bar. The color scale is saturated on purpose to display the off-diagonal terms. The top plot shows the diagonal elements of the matrix. The blocks, dots and lines that appear in the matrix reflect the correlations when the same map is used in Eq. (A.9).
Current usage metrics show cumulative count of Article Views (full-text article views including HTML views, PDF and ePub downloads, according to the available data) and Abstracts Views on Vision4Press platform.
Data correspond to usage on the plateform after 2015. The current usage metrics is available 48-96 hours after online publication and is updated daily on week days.
Initial download of the metrics may take a while.