Fig. C.2.
Download original image
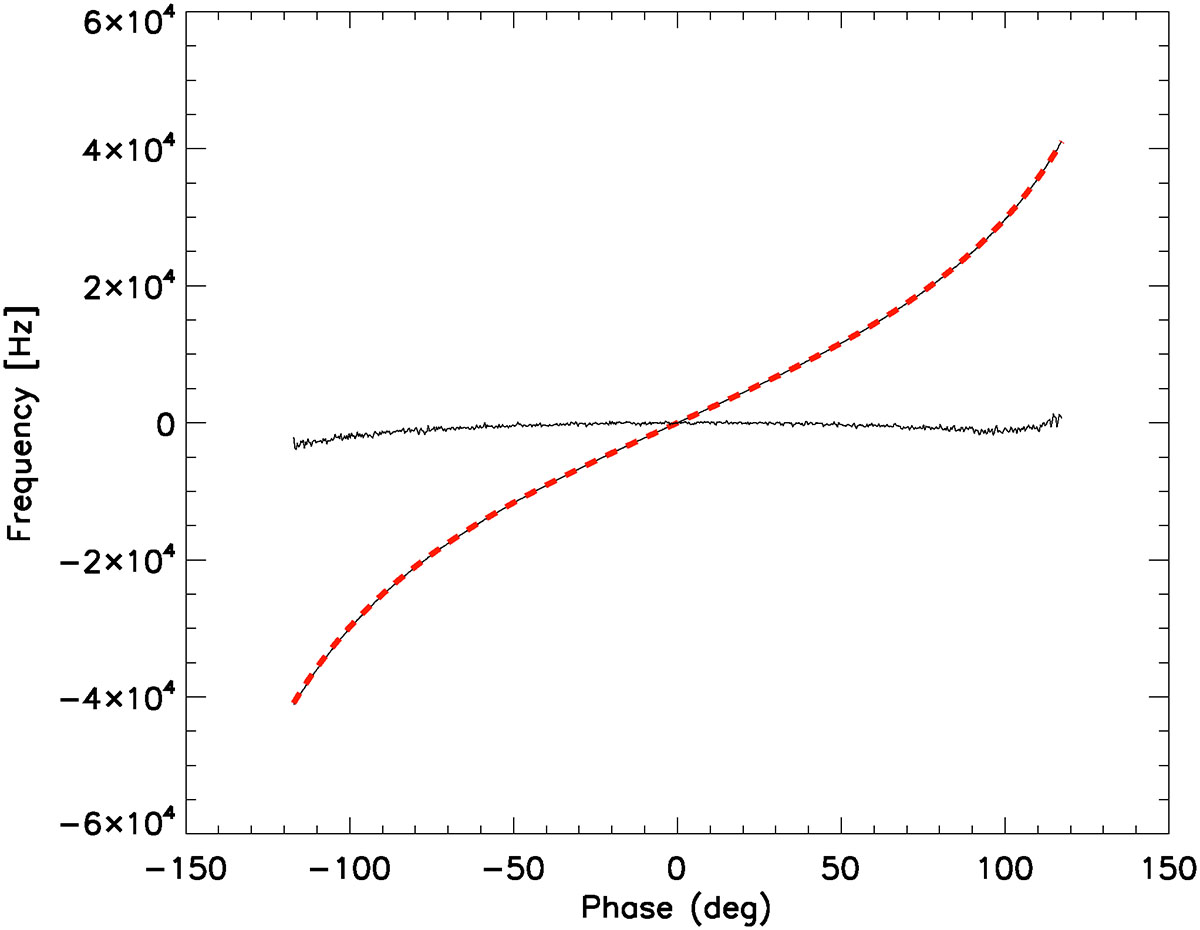
Comparison between the KID simulation and the 1D polynomial retrieval. Relative KID frequency as a function of the phase ϕ in the circle, as deduced from the 1D polynomial fit (grey curve) and from the initial simulation (red dashed curve). The small wiggly horizontal black line represents the residual frequency (grey curve minus red curve) multiplied by a factor ten for visibility, as a function of the same phase.
Current usage metrics show cumulative count of Article Views (full-text article views including HTML views, PDF and ePub downloads, according to the available data) and Abstracts Views on Vision4Press platform.
Data correspond to usage on the plateform after 2015. The current usage metrics is available 48-96 hours after online publication and is updated daily on week days.
Initial download of the metrics may take a while.