Fig. 2.
Download original image
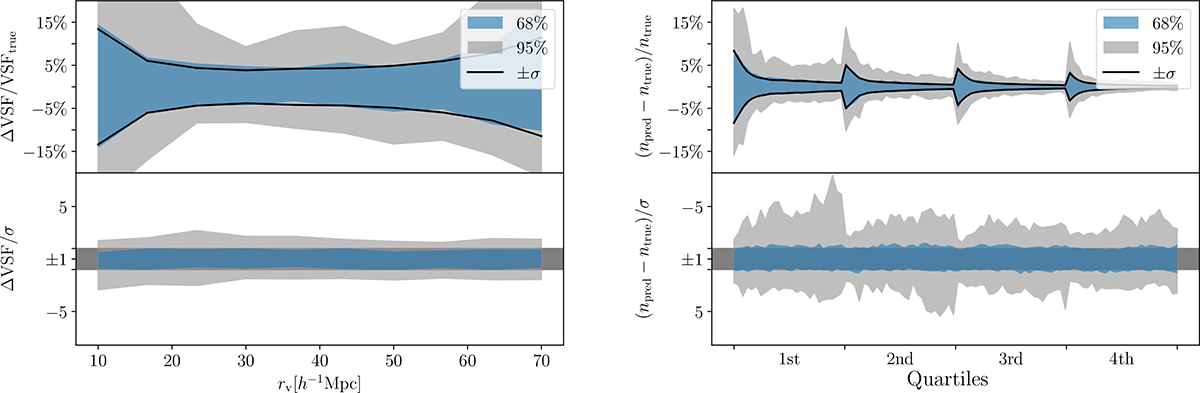
Residuals of (a) the VSF emulator predictions and (b) the density profile emulator predictions on the test set show that both are highly accurate. The blue and gray bands indicate 68% and 95% of predictions on the test set, and the black line shows the deviation of 1σ as derived from the covariance estimate. For clarity we denote ![]() as VSF and Δ denotes the difference of its prediction with respect to the measurement from the corresponding box. As defined in the main body, each profile (here binned by rv into quartiles) spans from 0.3 × rv to 2.7 × rv.
as VSF and Δ denotes the difference of its prediction with respect to the measurement from the corresponding box. As defined in the main body, each profile (here binned by rv into quartiles) spans from 0.3 × rv to 2.7 × rv.
Current usage metrics show cumulative count of Article Views (full-text article views including HTML views, PDF and ePub downloads, according to the available data) and Abstracts Views on Vision4Press platform.
Data correspond to usage on the plateform after 2015. The current usage metrics is available 48-96 hours after online publication and is updated daily on week days.
Initial download of the metrics may take a while.