Fig. 5.
Download original image
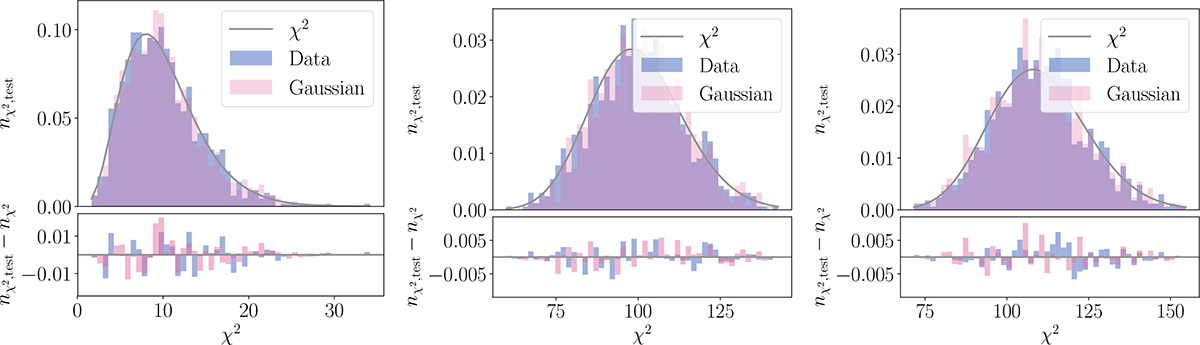
Test of the Gaussian likelihood assumption. Each panel shows the distribution of χ2s for a different data vector in the CV set, and for a synthetic data vector drawn from a Gaussian distribution with means and standard deviations estimated from the CV set. A Gaussian data vector will result in the χ2 values being distributed according to a χ2 distribution. All three distributions are close to the analytic χ2 distribution, supporting the Gaussianity assumption.
Current usage metrics show cumulative count of Article Views (full-text article views including HTML views, PDF and ePub downloads, according to the available data) and Abstracts Views on Vision4Press platform.
Data correspond to usage on the plateform after 2015. The current usage metrics is available 48-96 hours after online publication and is updated daily on week days.
Initial download of the metrics may take a while.