Open Access
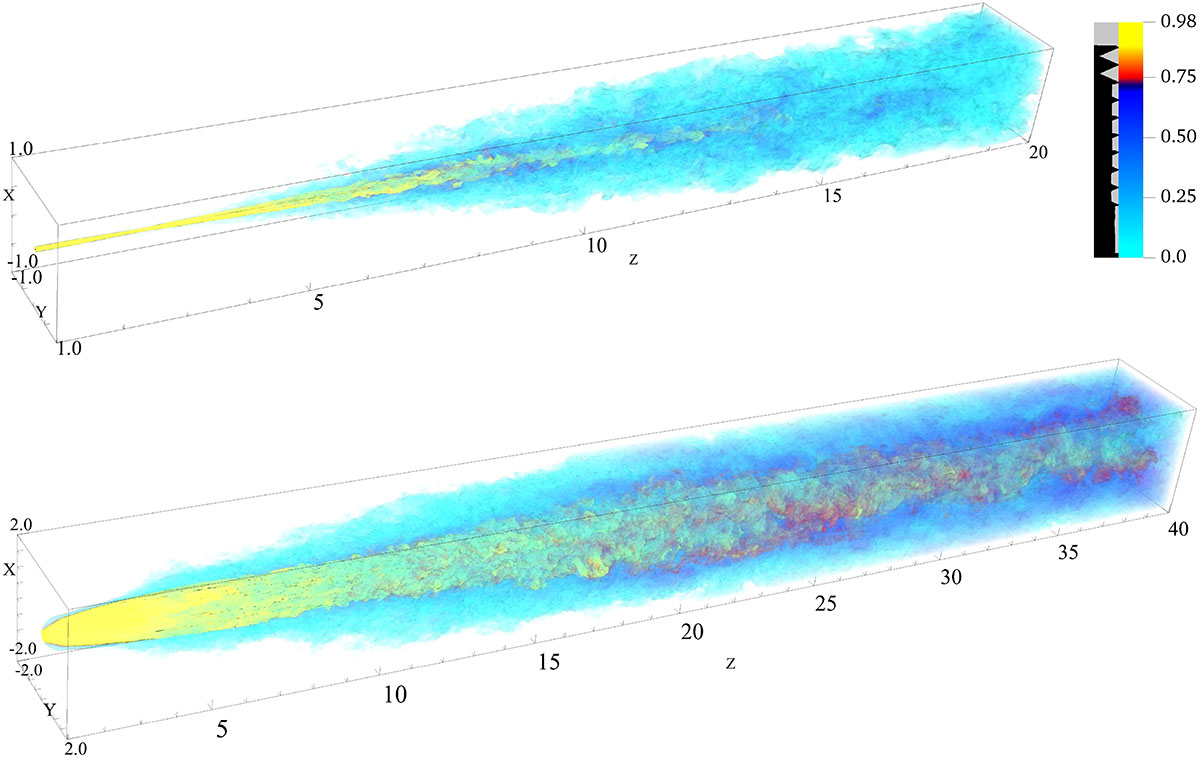
Fig. 18.
Download original image
Three-dimensional volume rendering of βz(x, y, z, t = tl, 3D) at the end of the simulation for case SHC05 (top panel) and case SLWw2 (bottom panel). The black-gray bar on the left of the color-bar shows which values of βz are opaque (gray), and which are transparent (black). We note that the box is larger in the SLWw2 case.
Current usage metrics show cumulative count of Article Views (full-text article views including HTML views, PDF and ePub downloads, according to the available data) and Abstracts Views on Vision4Press platform.
Data correspond to usage on the plateform after 2015. The current usage metrics is available 48-96 hours after online publication and is updated daily on week days.
Initial download of the metrics may take a while.