Fig. 1
Download original image
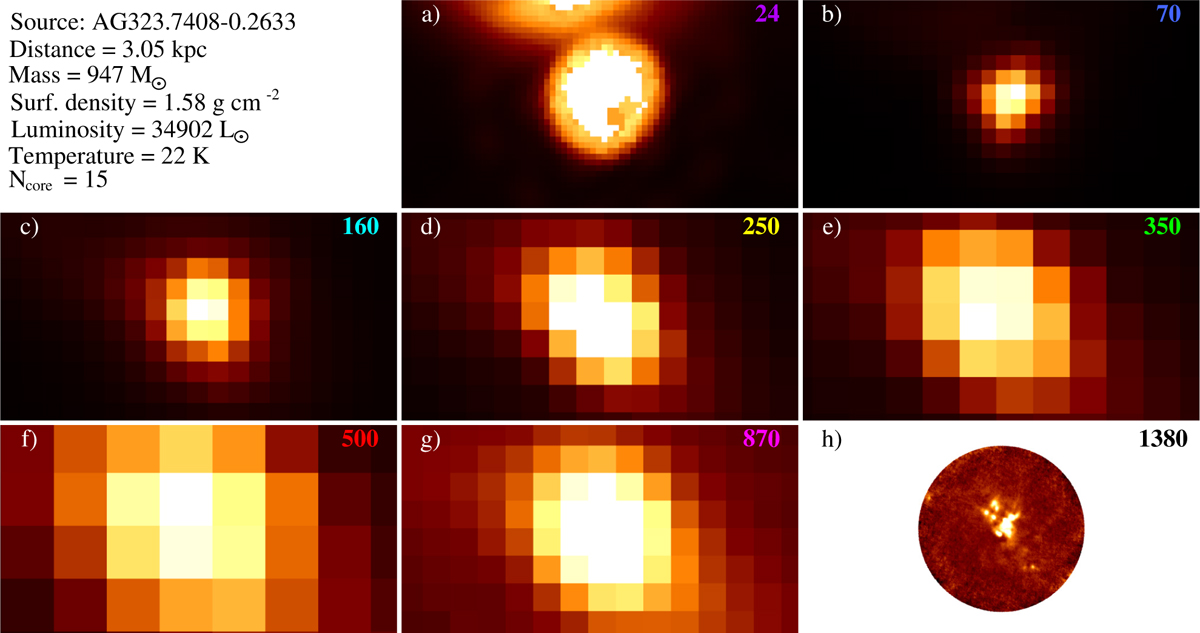
Example of an ALMAGAL target observed from mid-infrared to millimeter. The ALMAGAL ID (AG323.7408-0.2633), its physical parameters (Molinari et al. 2025), and the number of cores detected in ALMAGAL continuum observations (Coletta et al. 2025) are reported in the top-left corner of the figure. Panels a–h: source images (~80″ × 45″) at wavelengths increasing from 24 μm to 1.38 mm. The wavelength in micrometers is reported in the top-right corner of each panel. Panel a: Spitzer-MIPS image of the source (saturated in the center). Panels b and c: Herschel-PACS images. Panels d–f: Herschel-SPIRE images. Panel g: the ATLASGAL image. Panel h: new ALMAGAL image. In this image, 15 fragments were detected by Coletta et al. (2025). Angular resolutions in the different panels are as follows: a: 6″; b: 10.2″ (for this panel and the following four, the resolution value is not the nominal one for Herschel, but rather the one directly measured by Traficante et al. 2011, on Hi-GAL maps, and circularized here); c: 13.5″; d: 23″; e: 30″; f: 42″; g: 19″; and h: 0.5″. Being detected at 70 μm (and also at 24 μm, in this case), this source is classified as star-forming in accordance with the Hi-GAL catalog criteria.
Current usage metrics show cumulative count of Article Views (full-text article views including HTML views, PDF and ePub downloads, according to the available data) and Abstracts Views on Vision4Press platform.
Data correspond to usage on the plateform after 2015. The current usage metrics is available 48-96 hours after online publication and is updated daily on week days.
Initial download of the metrics may take a while.