Fig. 11
Download original image
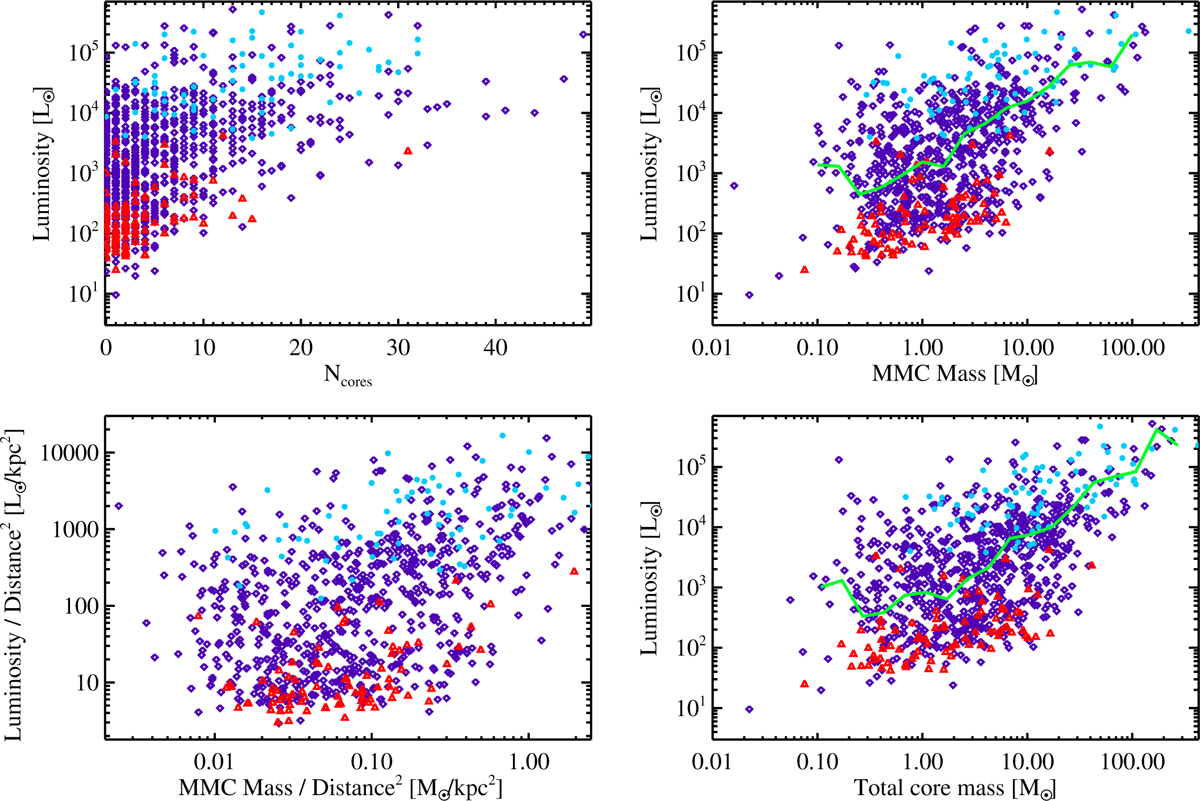
Clump bolometric luminosity L plotted against the fragmentation level (top left), mass of the MMC (top right), mass of the MMC normalized by the square of the distance (with luminosity normalized as well, bottom left), and sum of core masses (bottom right). The symbol and color-coding used for source subclasses is the same as in Figure 4 and throughout the paper. In the top-right and bottom-right panels, the green line represents the median in bins of the quantity on the x-axis.
Current usage metrics show cumulative count of Article Views (full-text article views including HTML views, PDF and ePub downloads, according to the available data) and Abstracts Views on Vision4Press platform.
Data correspond to usage on the plateform after 2015. The current usage metrics is available 48-96 hours after online publication and is updated daily on week days.
Initial download of the metrics may take a while.