Fig. 13
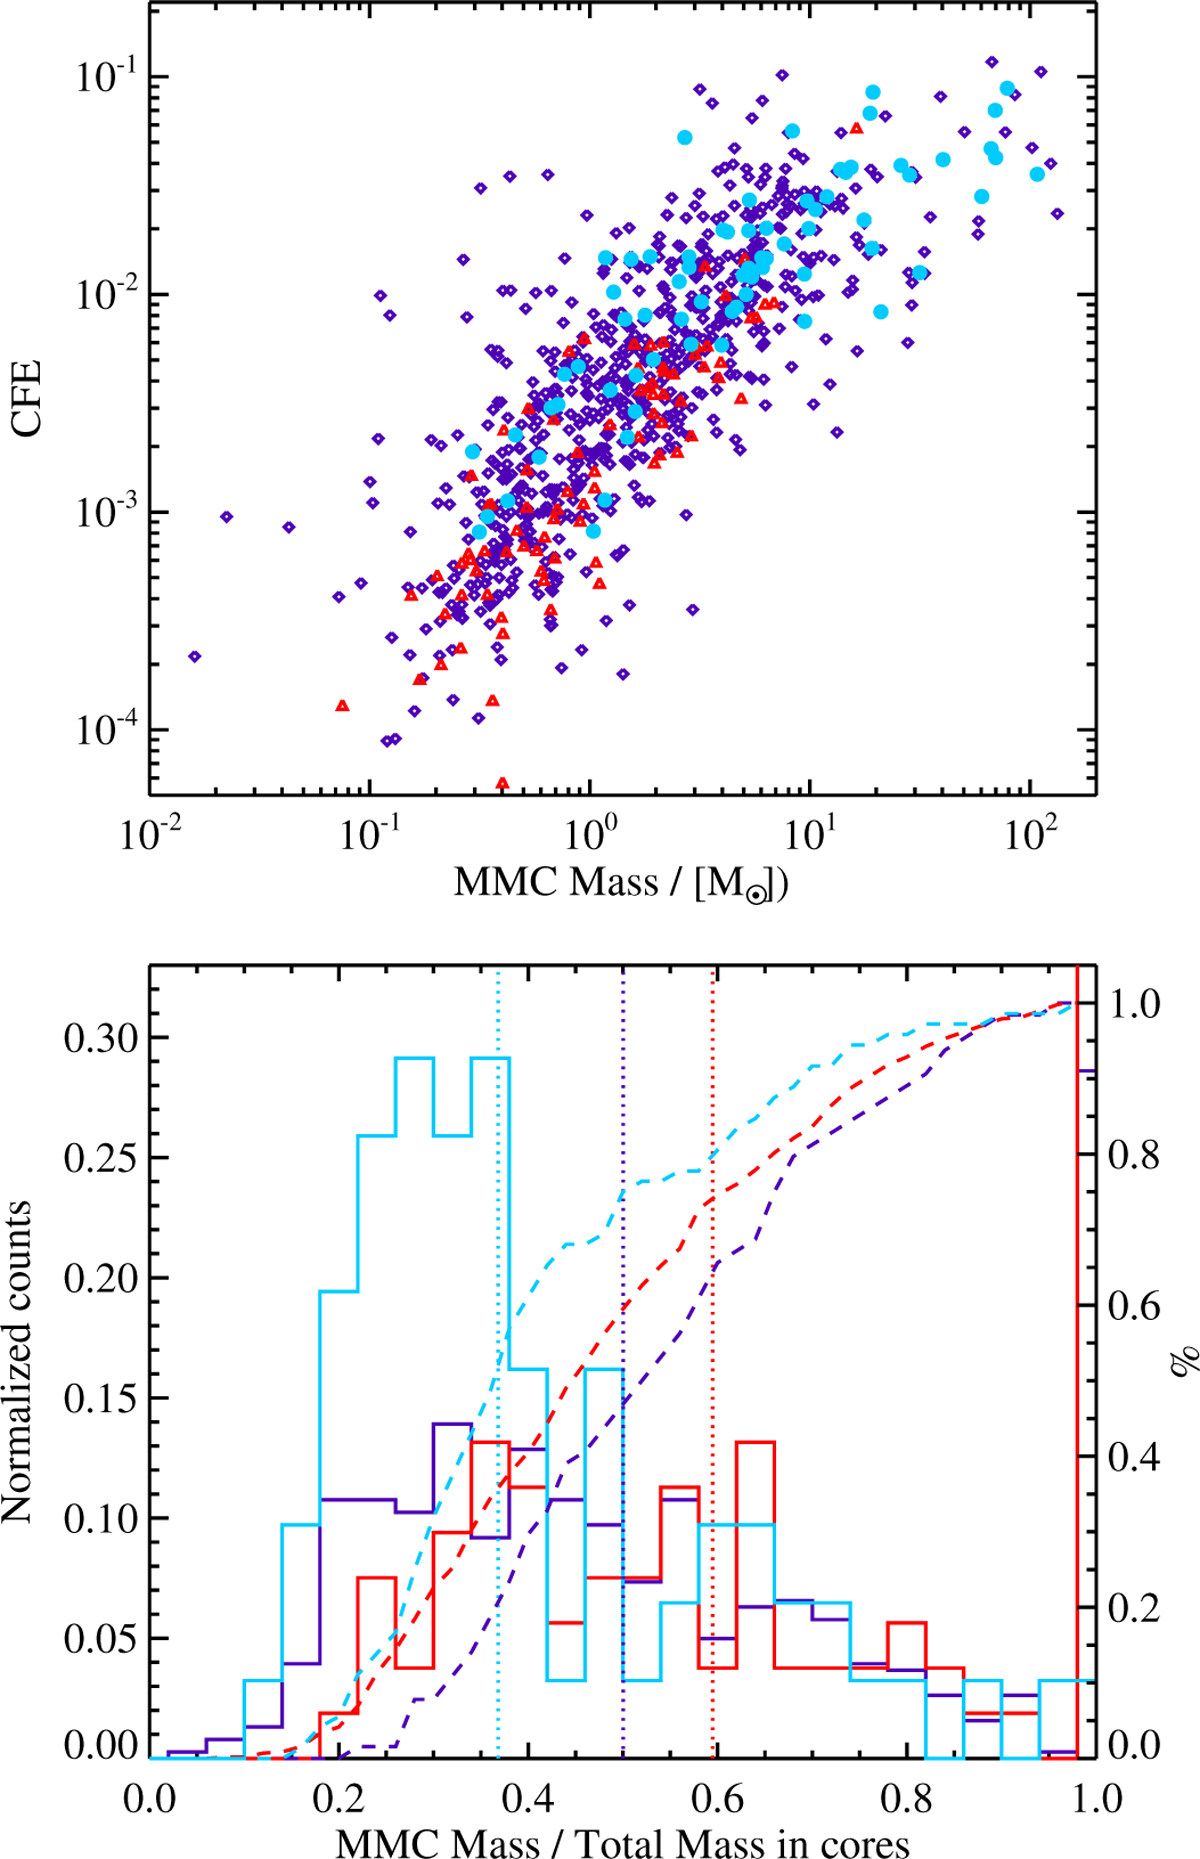
Download original image
Top: CFE against mass of the MMC (MMMC). Symbols are defined as in Figure 4. Bottom: distribution of the ratio between the mass of the MMC and the total mass contained in cores (excluding clumps with Ncore=0 or 1), shown separately for quiescent (red histogram), star forming (blue), and UCHII regions (cyan). The dashed curves represent the corresponding cumulative distributions, with values referenced to the y-axis on the right side of the plot. The vertical dotted lines mark the median values for each subclass, using the same color scheme as the histograms.
Current usage metrics show cumulative count of Article Views (full-text article views including HTML views, PDF and ePub downloads, according to the available data) and Abstracts Views on Vision4Press platform.
Data correspond to usage on the plateform after 2015. The current usage metrics is available 48-96 hours after online publication and is updated daily on week days.
Initial download of the metrics may take a while.