Fig. 17
Download original image
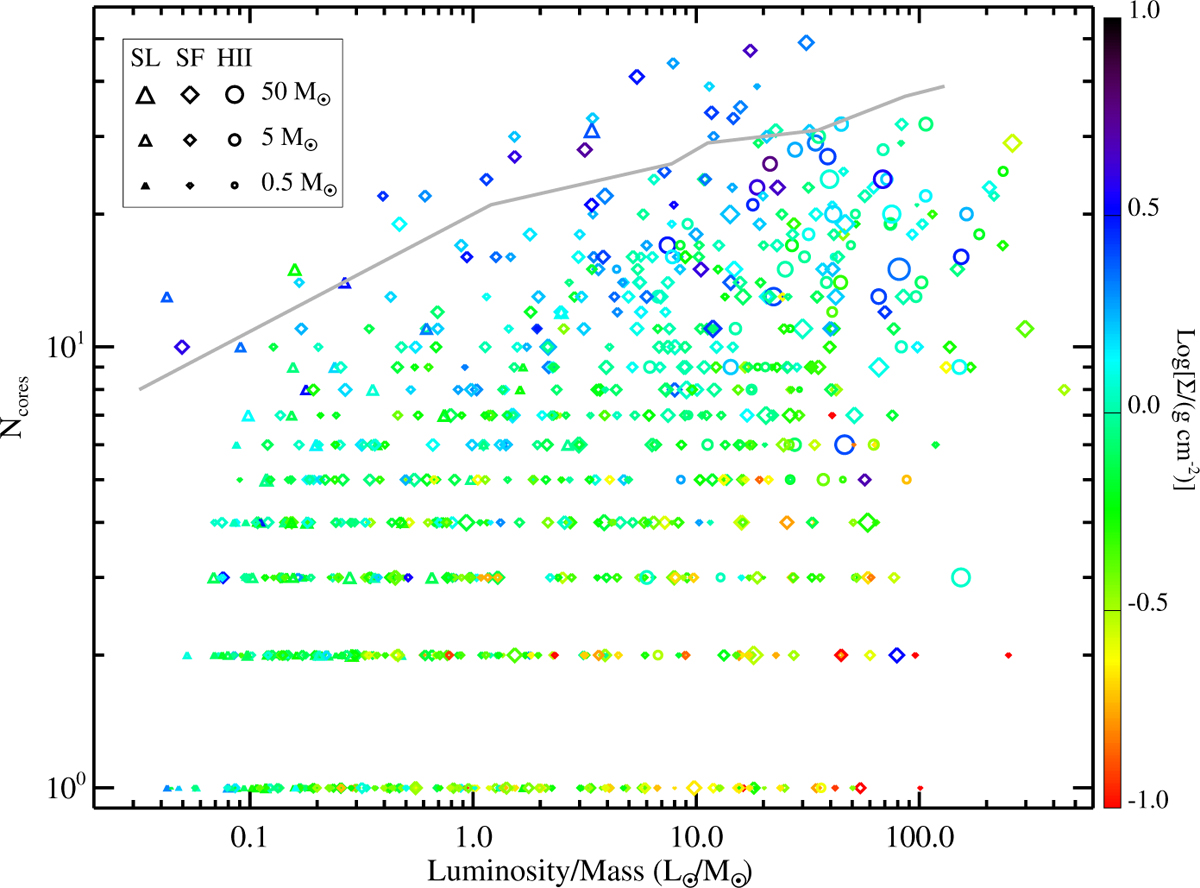
Same as panel d of Figure 7, but with different symbols and color-coding. The color scale is coded according to the logarithm of the clump surface density in grams per square centimeter (color bar on the right), and quiescent clumps (SL in the legend in the top-left corner), star-forming ones (SF), and UCHII counterparts (HII) are displayed by means of open triangles, open diamonds, and filled circles, respectively. The symbol size scales as the logarithm of the mass of the MMC, as shown in the legend. The solid gray line represents the numerical prediction by Lebreuilly et al. (2025) with initial conditions set to M = 500 M⊙, ℳ = 7, and μ = 10, also plotted in panel e of Figure 7 as an orange line.
Current usage metrics show cumulative count of Article Views (full-text article views including HTML views, PDF and ePub downloads, according to the available data) and Abstracts Views on Vision4Press platform.
Data correspond to usage on the plateform after 2015. The current usage metrics is available 48-96 hours after online publication and is updated daily on week days.
Initial download of the metrics may take a while.