Fig. 2
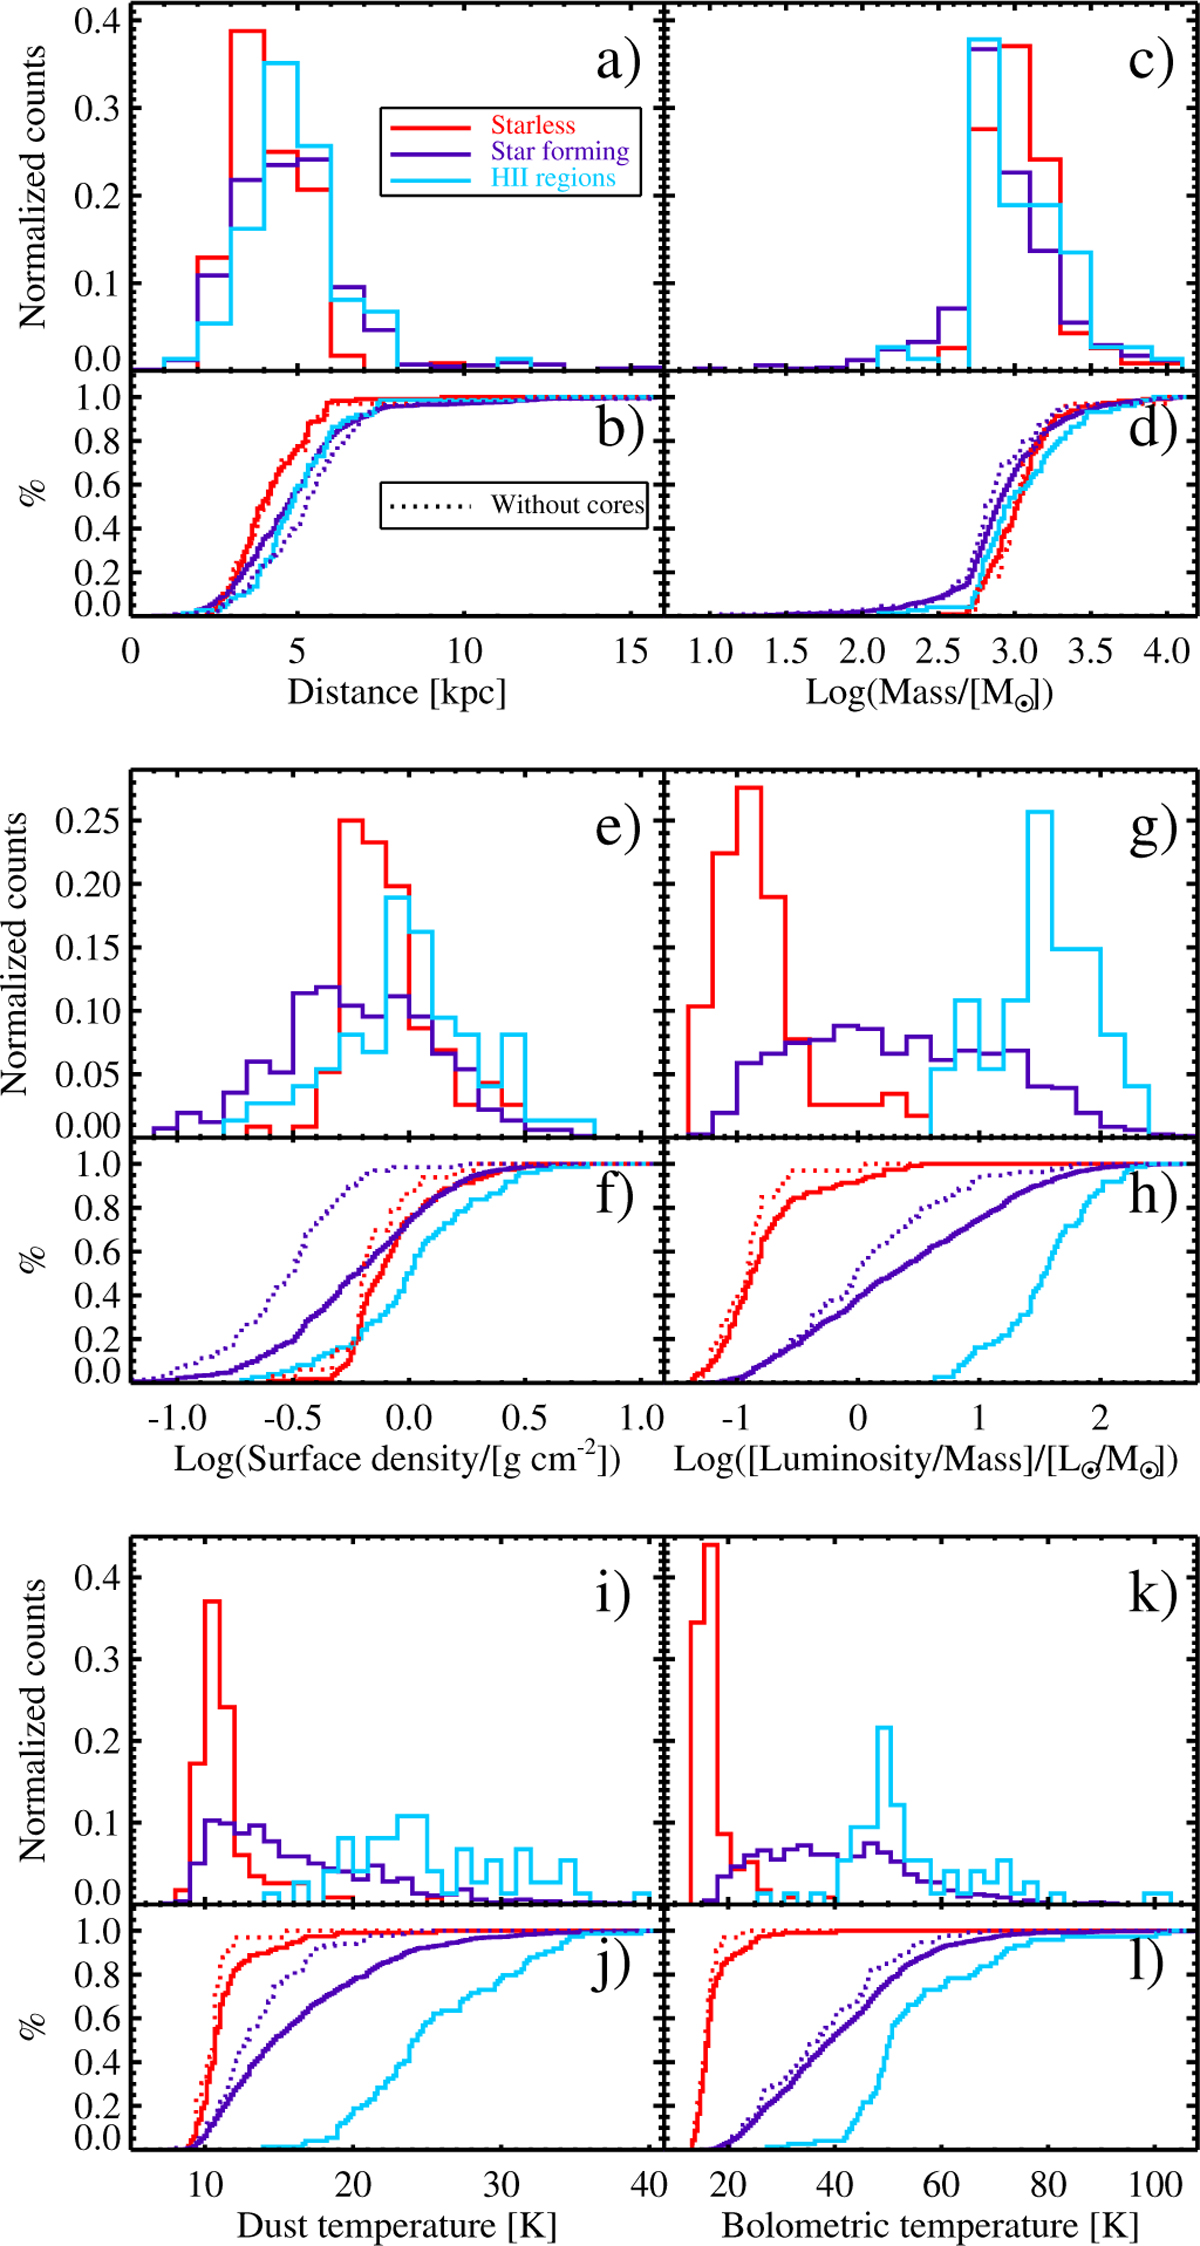
Download original image
Distributions of ALMAGAL target physical properties: (a) heliocentric distance; (c) mass (common logarithm); (e) surface density (common logarithm); (g) bolometric luminosity over mass ratio (common logarithm); (i) modified blackbody temperature; and (k) bolometric temperature. Panels b, d, f, h, j, and l: corresponding cumulative distributions. Three different populations are shown separately: in red, quiescent (70-μm dark) clumps; in blue, star-forming (70-μm bright) clumps; and in cyan, star-forming clumps associated with an UC HII region (notice that, differently from Elia et al. 2017, 2021, the counts of the third class of objects are not also included in those of the second class). All histograms are normalized by their total (116, 817, and 74 sources, respectively); therefore, they do not mirror the actual number ratios between clump classes. Units on the y-axis are arbitrary. Additionally, in the panels containing the cumulative distributions, the red and dotted curves correspond to the subsamples of quiescent and star-forming clumps with no detection of millimeter cores in ALMAGAL observations (discussed in Sect. 3.5). UCHII regions are not shown, as only one appears devoid of cores inside.
Current usage metrics show cumulative count of Article Views (full-text article views including HTML views, PDF and ePub downloads, according to the available data) and Abstracts Views on Vision4Press platform.
Data correspond to usage on the plateform after 2015. The current usage metrics is available 48-96 hours after online publication and is updated daily on week days.
Initial download of the metrics may take a while.