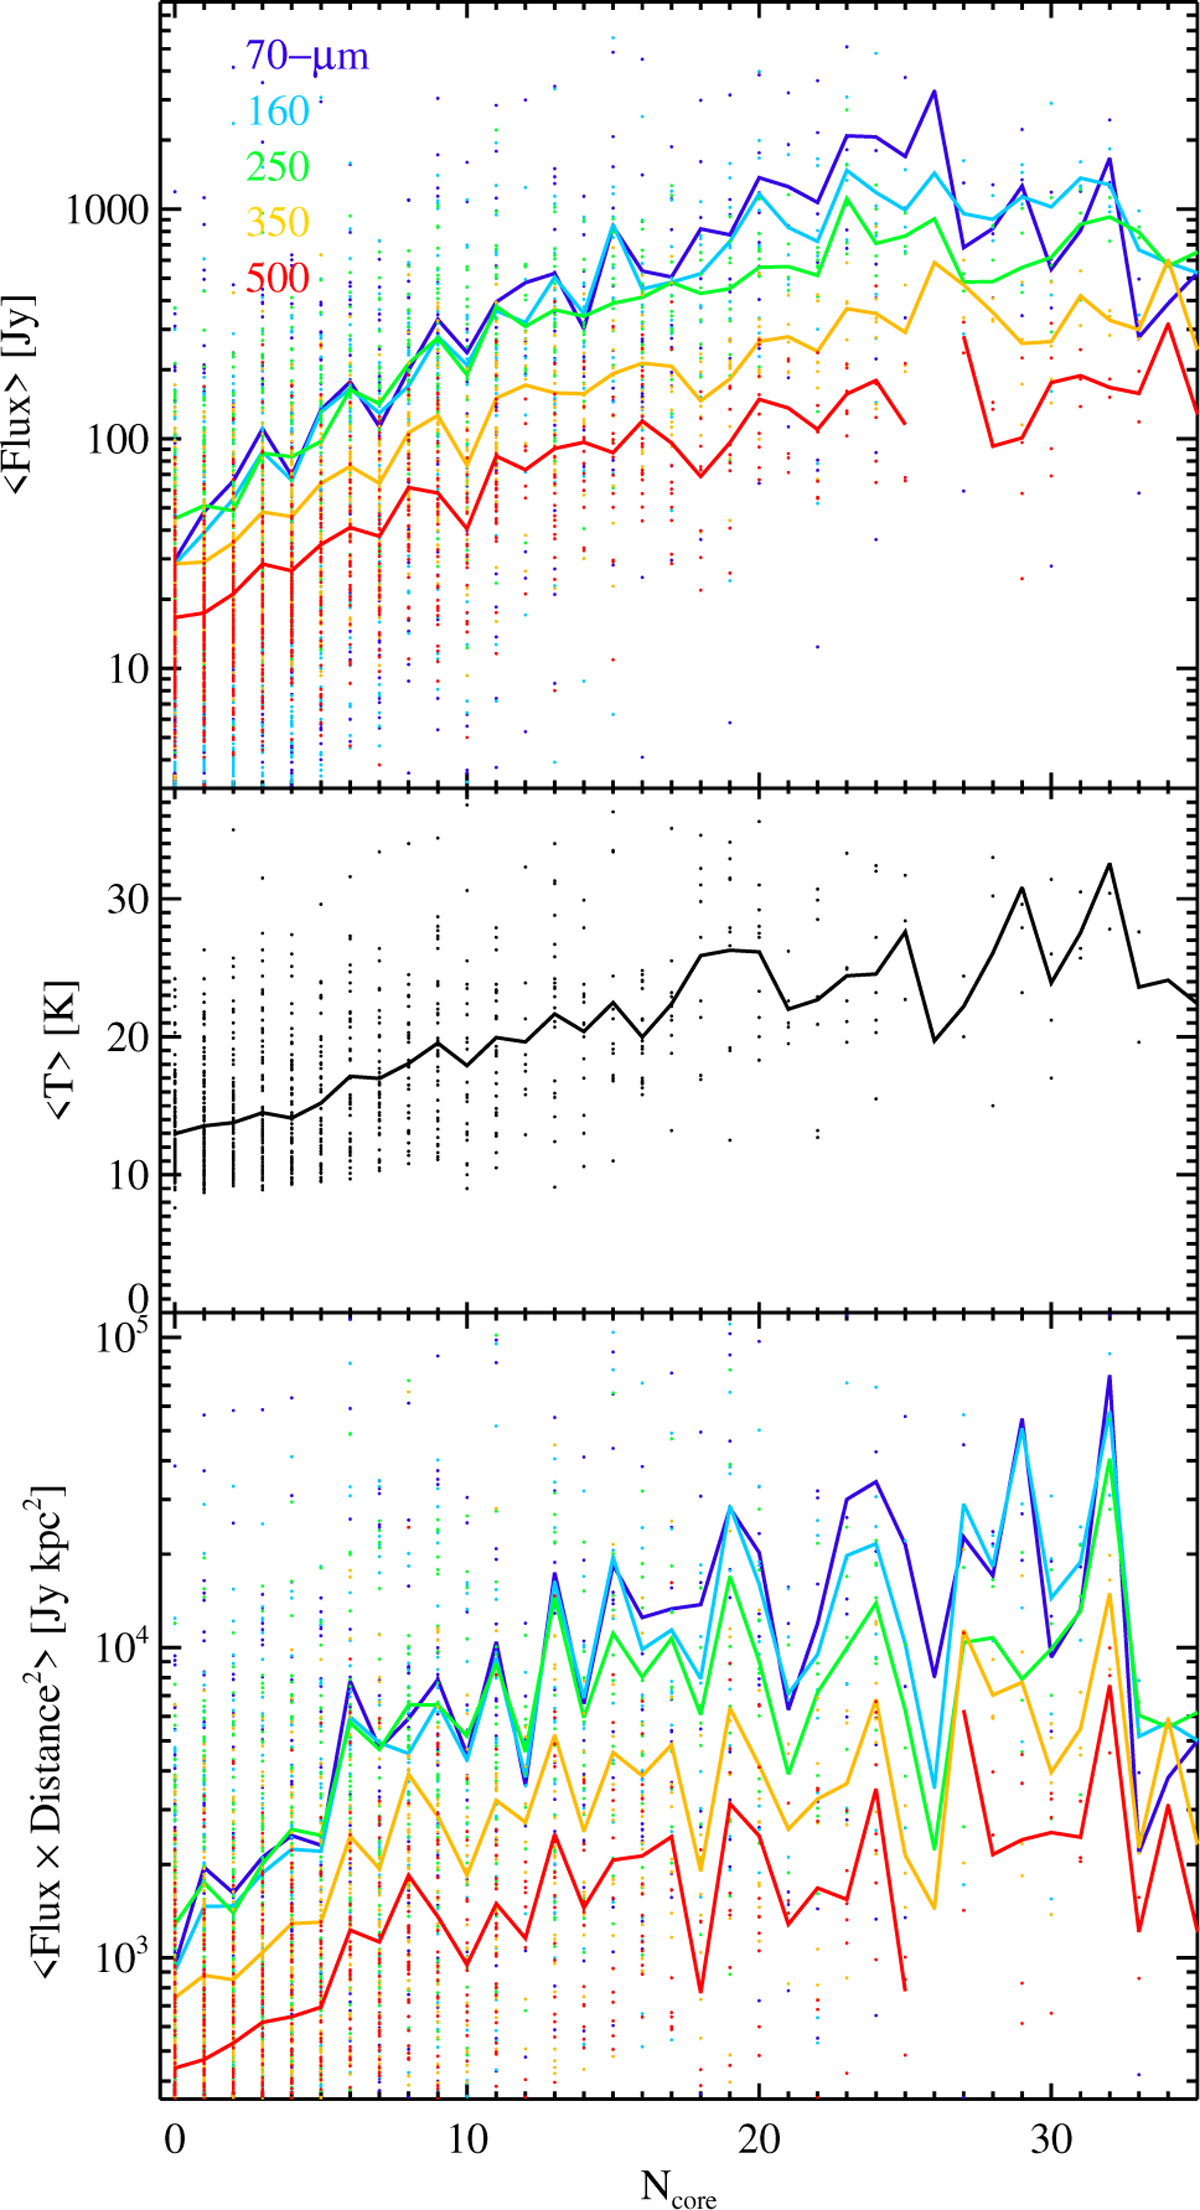
Fig. 3
Download original image
Properties of ALMAGAL targets as a function of the number of cores (Ncore) revealed in their interior. Top: fluxes in the five Hi-GAL bands and their averages in bins of ΔNcore = 1. The core-band correspondence is reported in the legend. Middle: temperature determined using a modified-blackbody fit to the Hi-GAL SEDs and its average. Bottom: as in the top panel, but for the product of flux densities and the squared distance. In both the top and bottom panels, a break in the red curve corresponds to a bin populated by sources without a 500 μm detection.
Current usage metrics show cumulative count of Article Views (full-text article views including HTML views, PDF and ePub downloads, according to the available data) and Abstracts Views on Vision4Press platform.
Data correspond to usage on the plateform after 2015. The current usage metrics is available 48-96 hours after online publication and is updated daily on week days.
Initial download of the metrics may take a while.