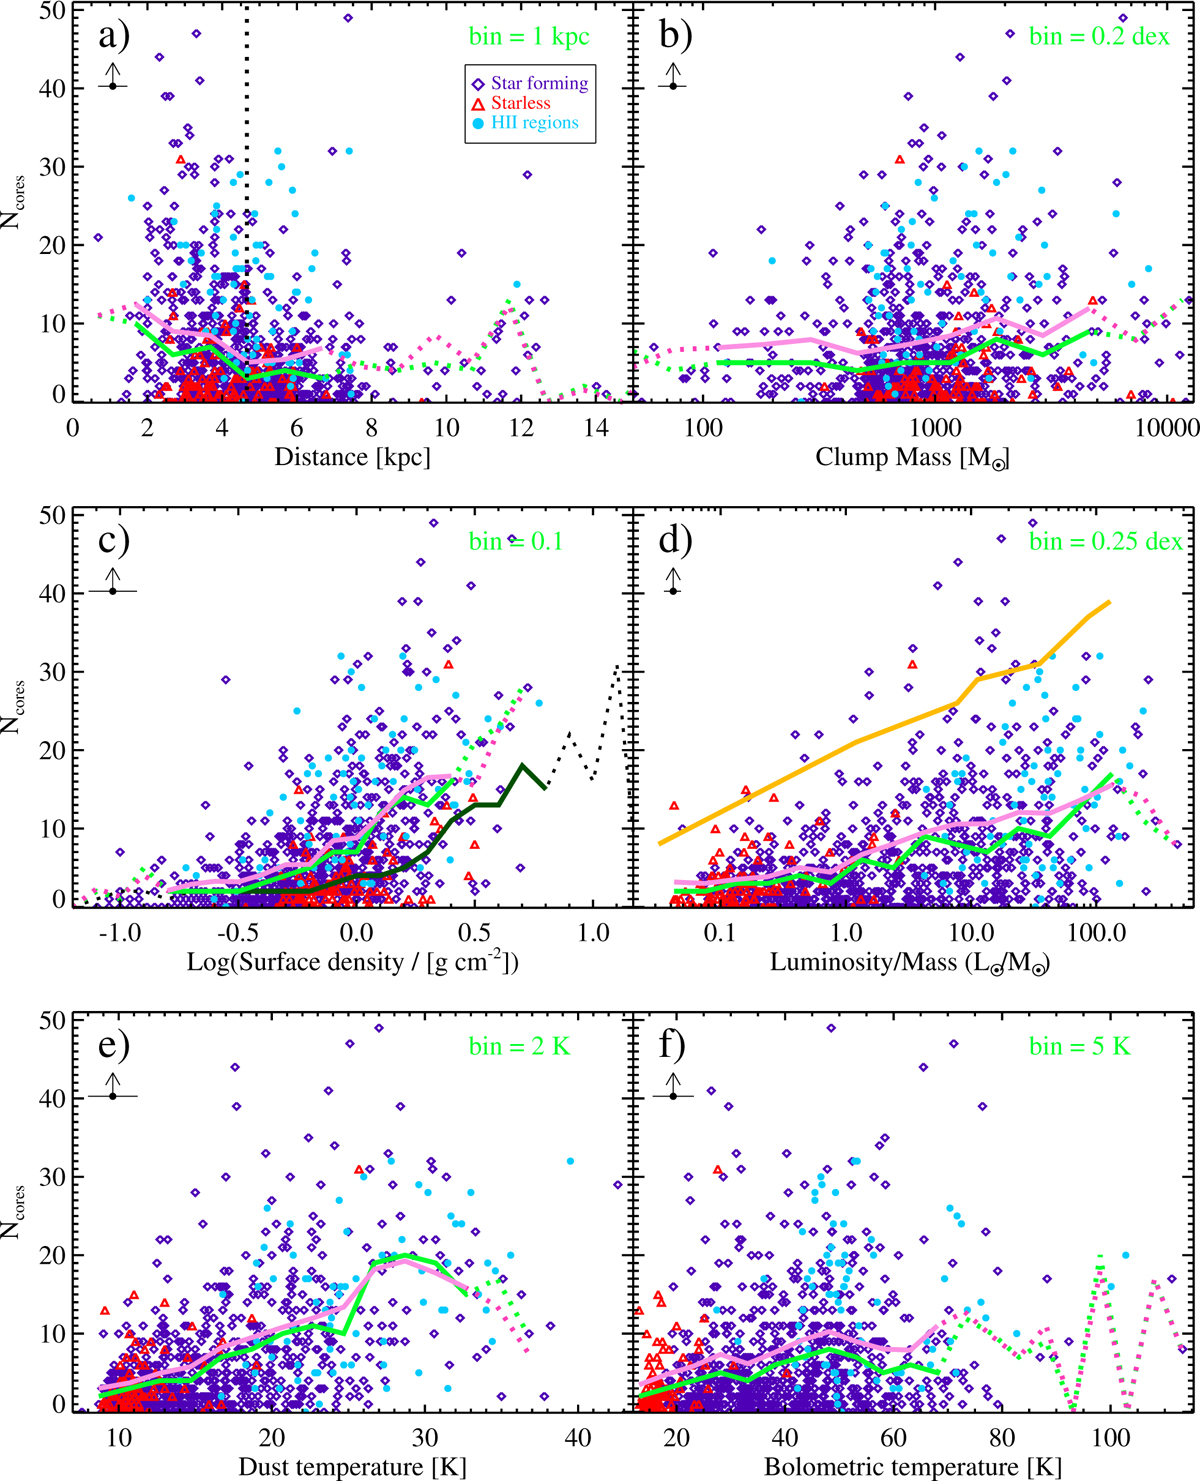
Fig. 4
Download original image
Number of fragments Ncore detected in each ALMAGAL target as a function of the target’s physical parameters: (a) heliocentric distance, with the vertical dotted line separating the distances originally assigned to the “near” and the “far” sample (see text); (b) mass; (c) surface density (logarithm); (d) luminosity over mass ratio, with the orange line representing the model prediction from Lebreuilly et al. (2025) with initial conditions set to M = 500 M⊙, ℳ = 7, and μ = 10 (presented and discussed in Sect. 6.2.2); (e) modified blackbody temperature; and (f) bolometric temperature, respectively. The open red triangles represent quiescent clumps; open dark blue diamonds represent star-forming clumps; and light blue-filled circles represent counterparts of a UCHII region. The symbol under each panel represents the typical error bar associated with the data. In this case, the vertical error bar is replaced by an arrow to indicate the number of detected cores likely representing an underestimate of the “actual” Ncore. The green line connects the medians of Ncore in bins (whose width is specified in green as well); its dotted parts correspond to bins containing low statistics (less than ten values). In panel c, medians calculated in bins of surface densities but based on deconvolved clump sizes are also represented as a dark solid or dotted green line. The mean values are also shown, connected by a magenta line.
Current usage metrics show cumulative count of Article Views (full-text article views including HTML views, PDF and ePub downloads, according to the available data) and Abstracts Views on Vision4Press platform.
Data correspond to usage on the plateform after 2015. The current usage metrics is available 48-96 hours after online publication and is updated daily on week days.
Initial download of the metrics may take a while.