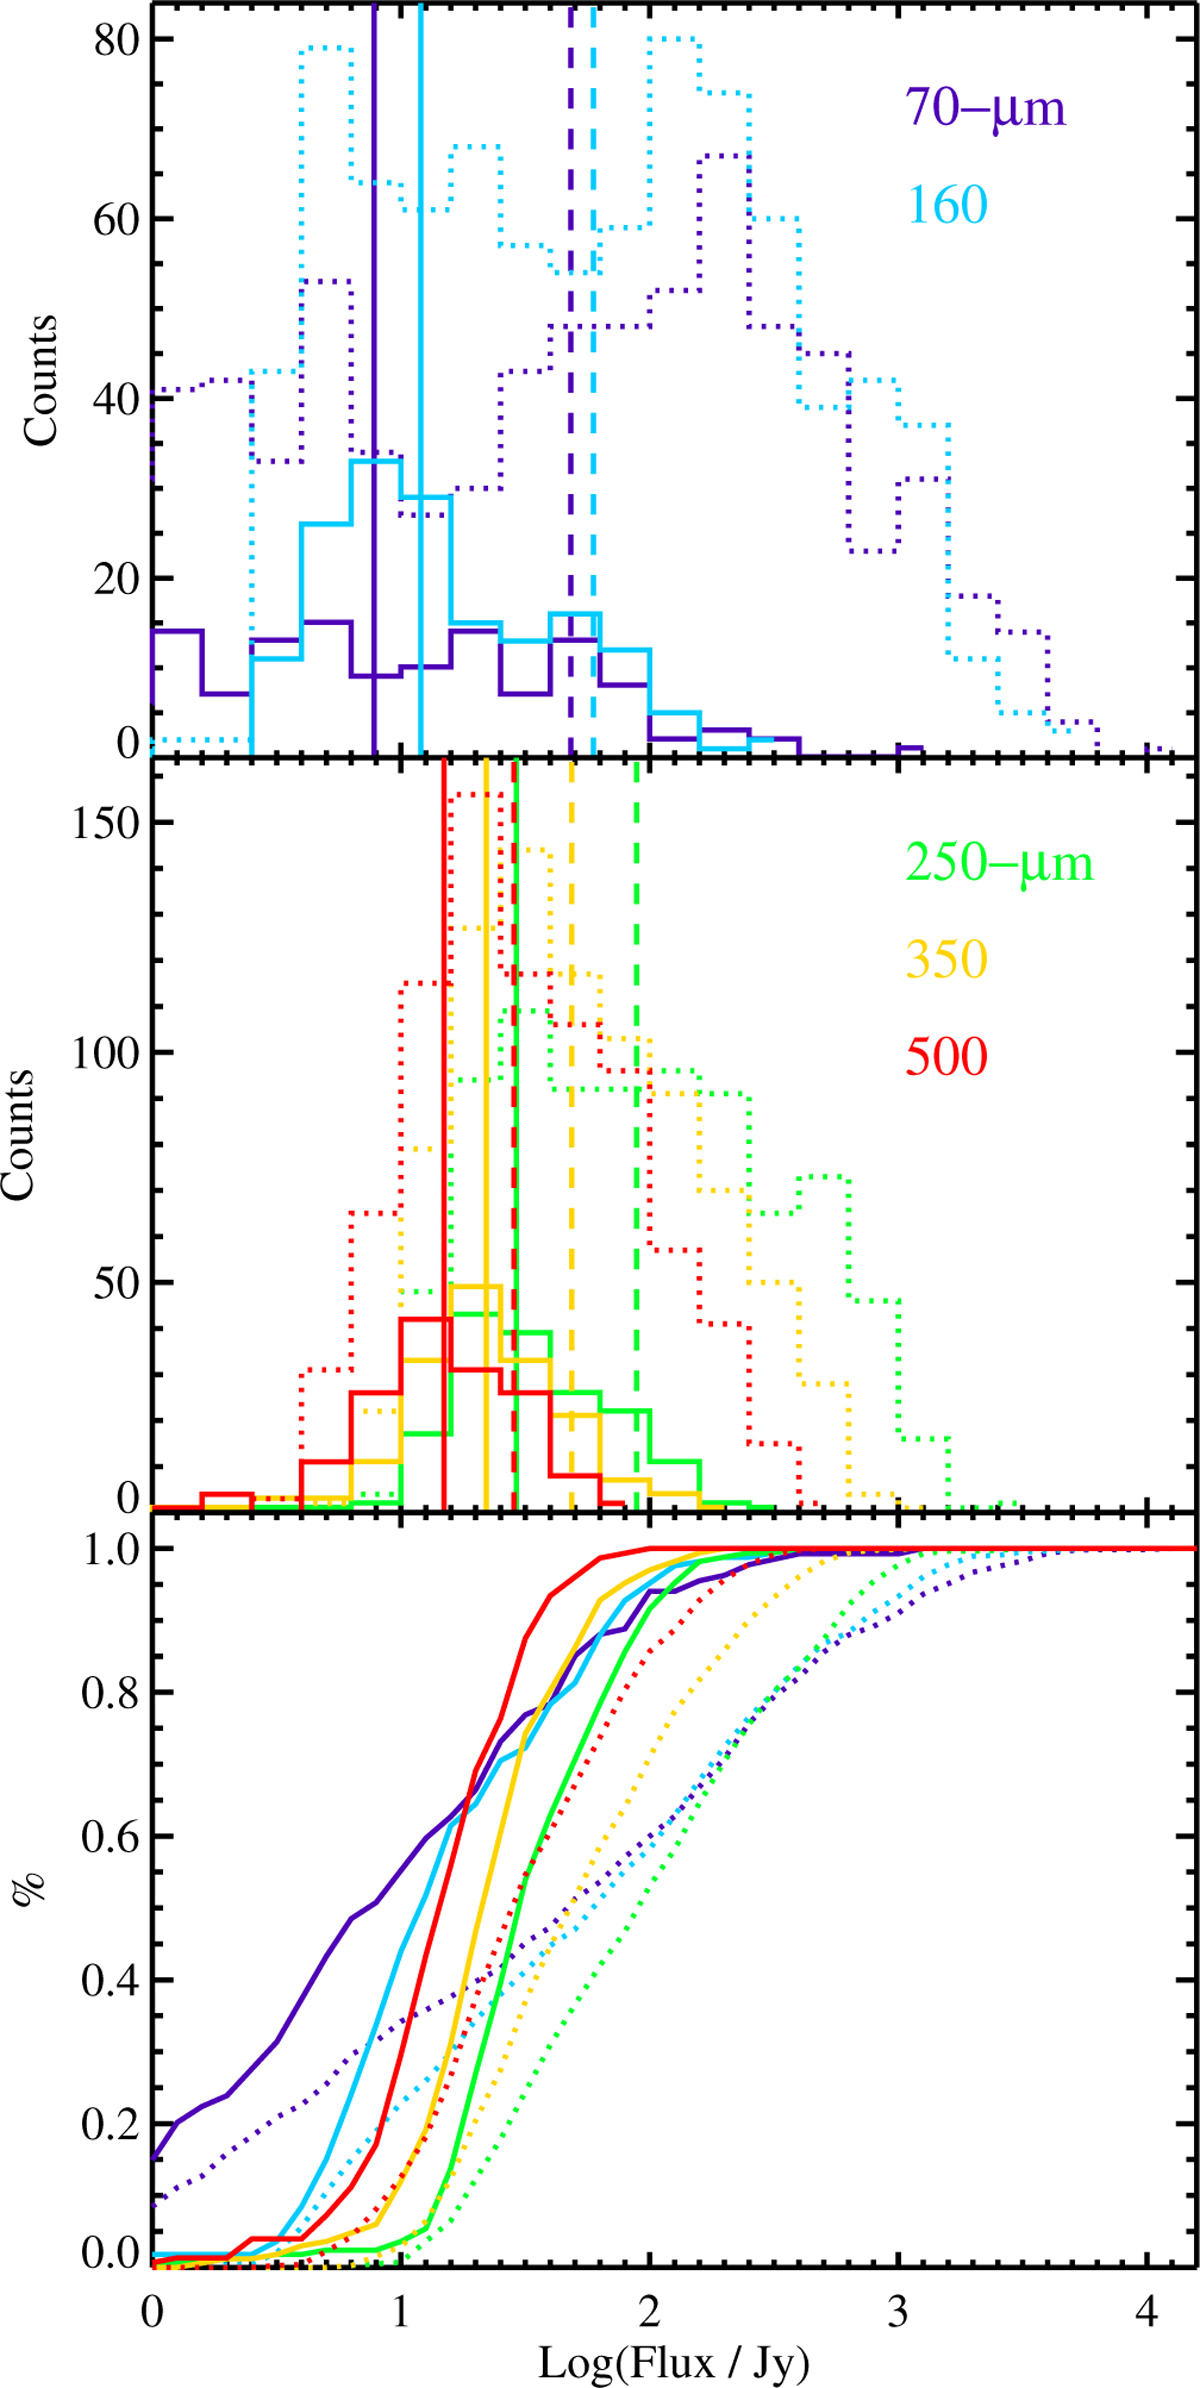
Fig. 6
Download original image
Top: histograms of Hi-GAL PACS flux densities (dark blue: 70 μm; light blue: 160 μm) for ALMAGAL targets with and without the detection of cores (dotted and solid line, respectively). The median values for the two subsamples are shown as vertical dashed and solid lines of the same color, respectively. Middle: same as in the top panel, but for SPIRE flux density distributions (green: 250 μm; yellow: 350 μm; and red: 500 μm). Bottom: cumulative distributions of histograms shown in the top and middle panels, using the same color and line style convention.
Current usage metrics show cumulative count of Article Views (full-text article views including HTML views, PDF and ePub downloads, according to the available data) and Abstracts Views on Vision4Press platform.
Data correspond to usage on the plateform after 2015. The current usage metrics is available 48-96 hours after online publication and is updated daily on week days.
Initial download of the metrics may take a while.