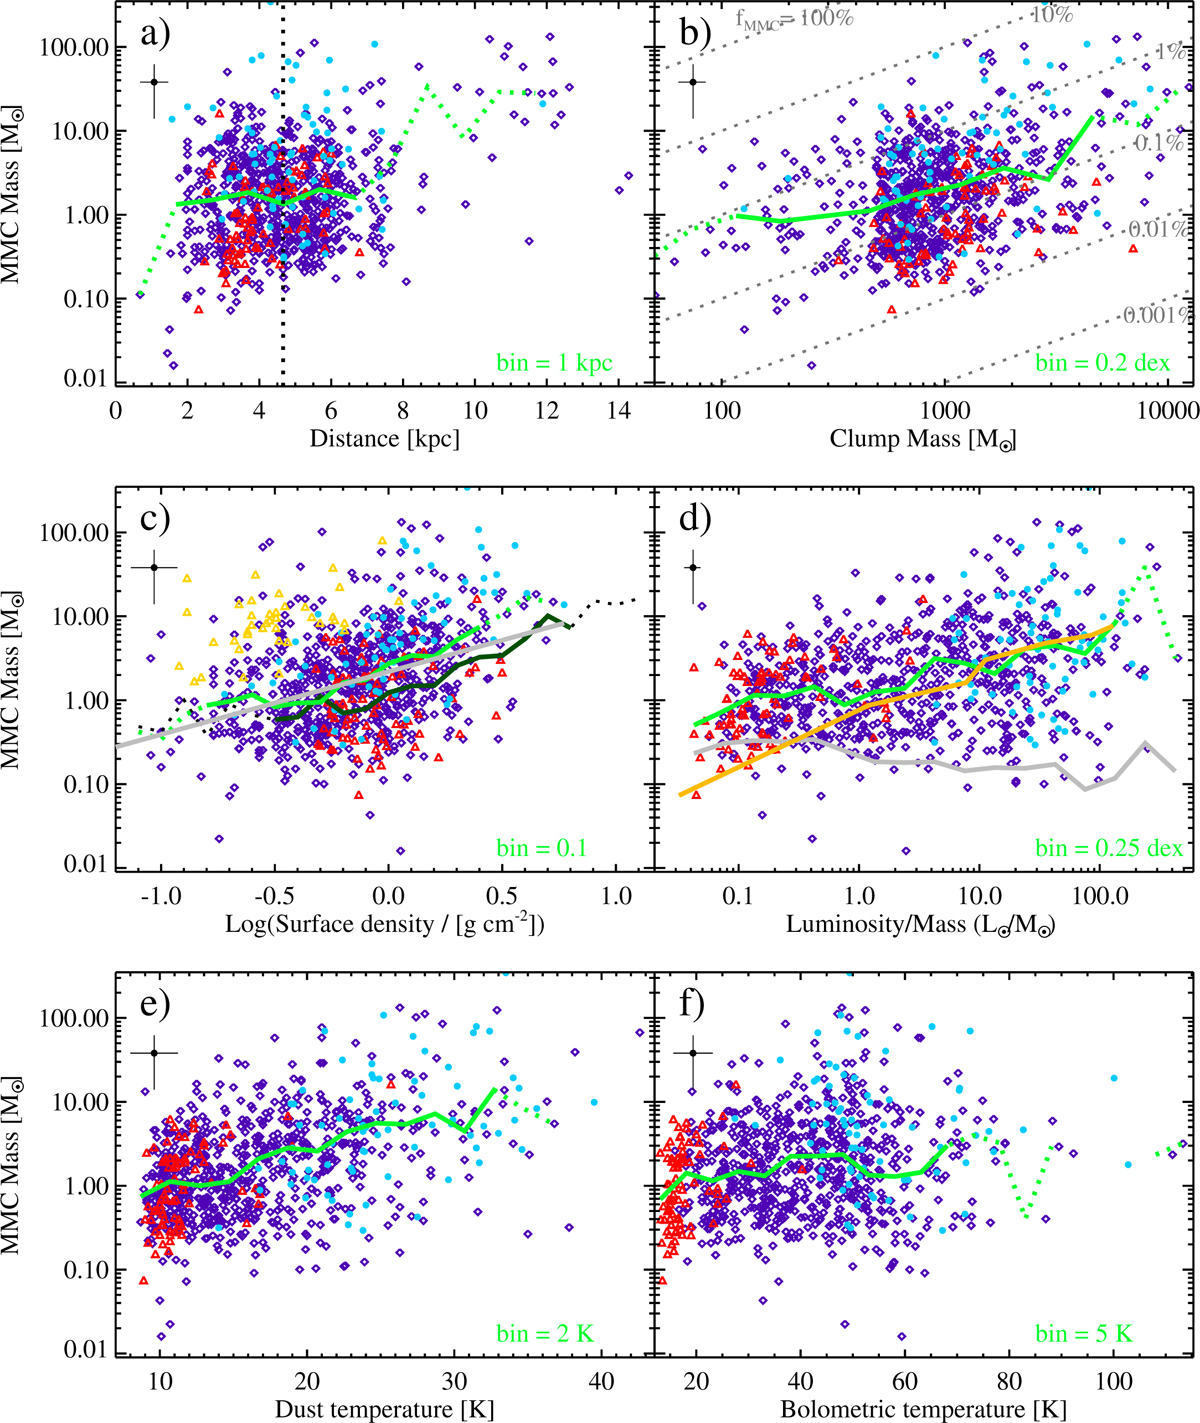
Fig. 7
Download original image
Same as Figure 4, but for the MMC mass along the y-axis of each panel. The symbol under each panel represents the typical error bar associated with the data. The dotted gray lines in panel b indicate the trends for constant fMMC values. In panel c, the solid gray line indicates the power-law fit to the data, and the open yellow triangles represent data from Morii et al. (2023). In panel d, the gray line represents the median mass of the least massive core in each clump.
Current usage metrics show cumulative count of Article Views (full-text article views including HTML views, PDF and ePub downloads, according to the available data) and Abstracts Views on Vision4Press platform.
Data correspond to usage on the plateform after 2015. The current usage metrics is available 48-96 hours after online publication and is updated daily on week days.
Initial download of the metrics may take a while.