Open Access
Fig. 1.
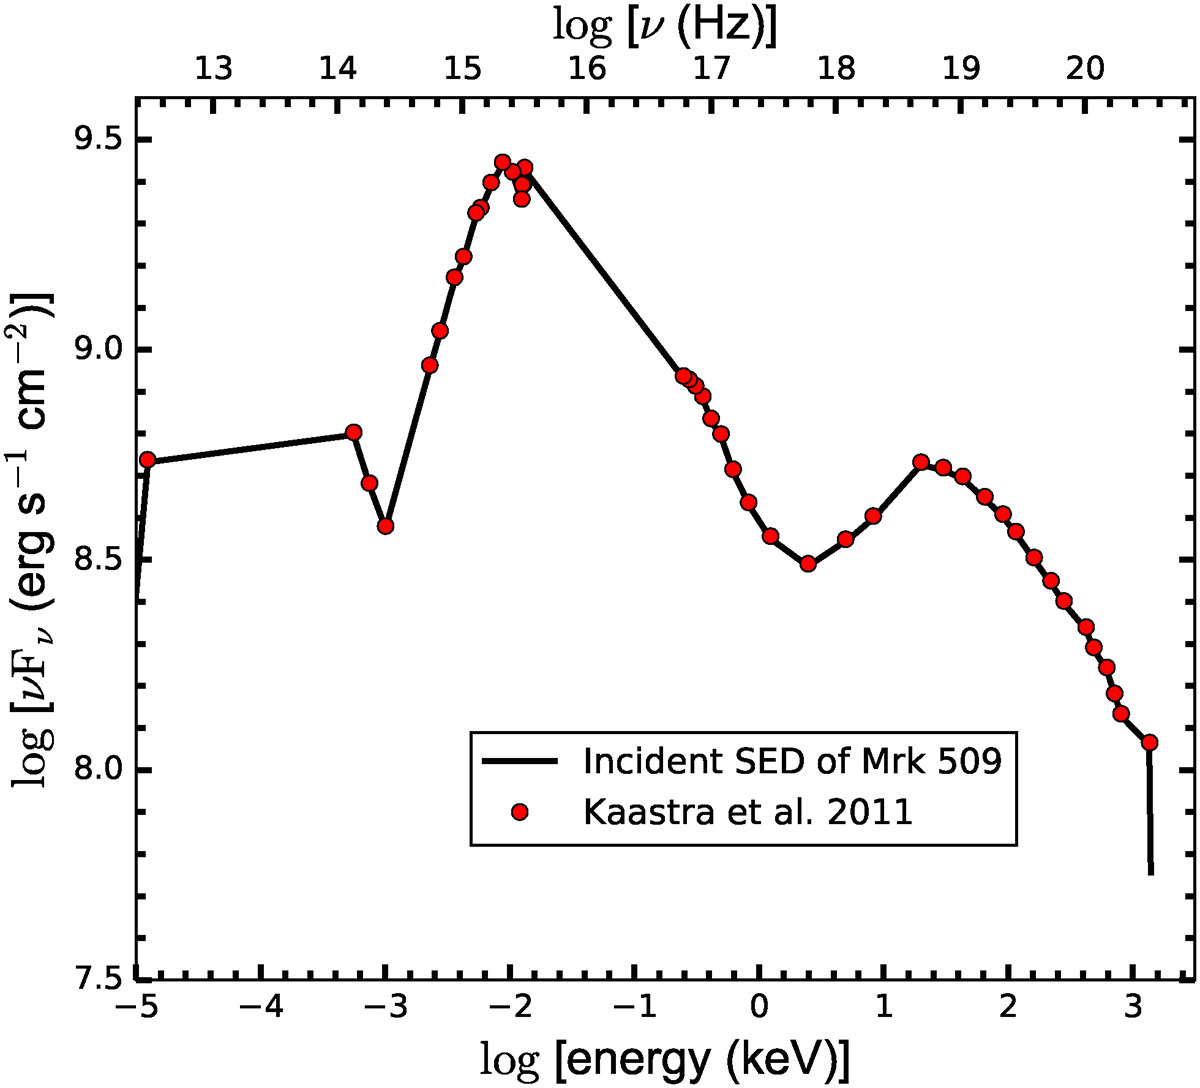
Download original image
Spectral energy distribution of Mrk 509 used as an input to the photoionization code TITAN marked as a solid black line. The red circles are the observational points reported by Kaastra et al. (2011) and normalized to the incident flux.
Current usage metrics show cumulative count of Article Views (full-text article views including HTML views, PDF and ePub downloads, according to the available data) and Abstracts Views on Vision4Press platform.
Data correspond to usage on the plateform after 2015. The current usage metrics is available 48-96 hours after online publication and is updated daily on week days.
Initial download of the metrics may take a while.