Fig. 2.
Download original image
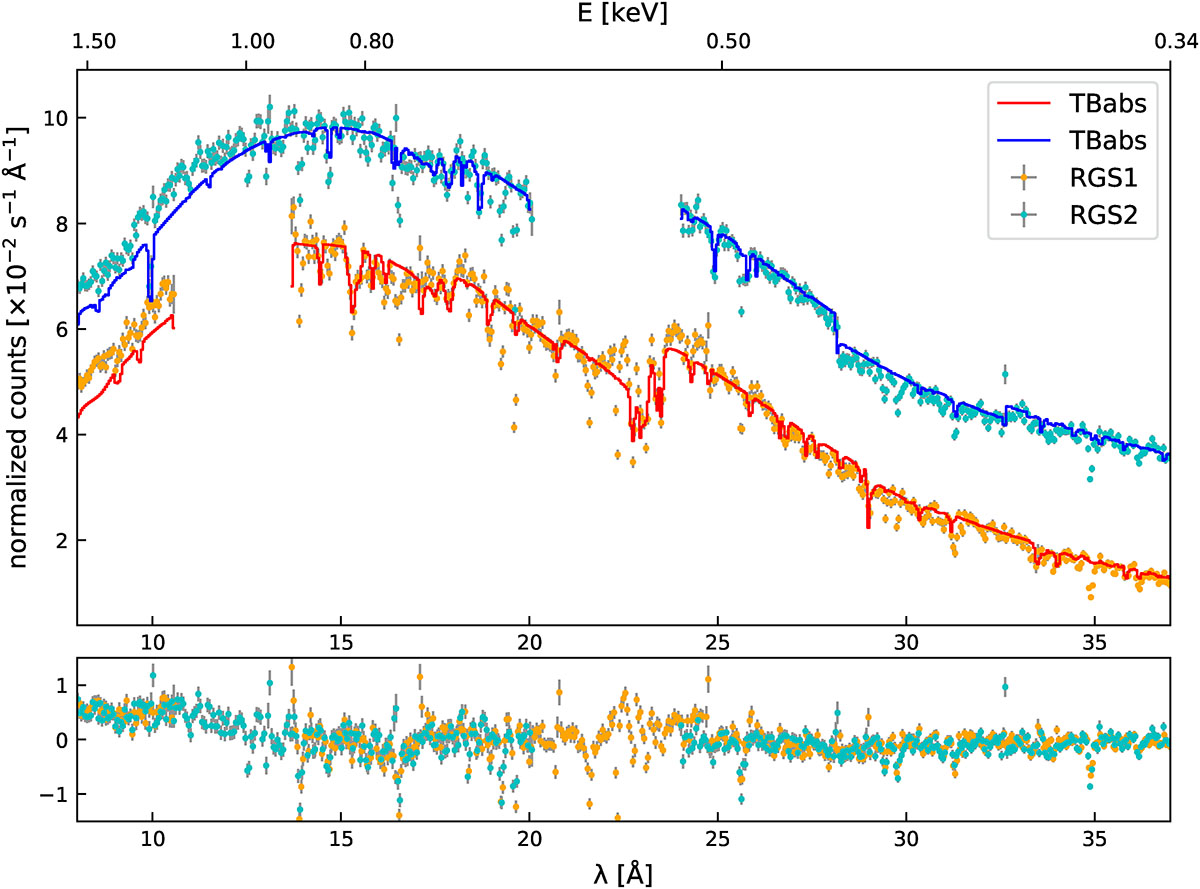
Continuum model and Galactic absorption fit to Mrk 509 RGS spectrum. RGS 1 and RGS 2 spectra are plotted in orange and cyan. RGS 2 is arbitrarily shifted by 0.02 counts s−1 Å−1. The continuum model of Mrk 509 SED absorbed by the Milky Way is marked with continuous red and blue lines. The lower panel shows residuals against the best-fit model. The wavelengths are in the observed frame of reference. For the purpose of this plot the data are binned by five channels.
Current usage metrics show cumulative count of Article Views (full-text article views including HTML views, PDF and ePub downloads, according to the available data) and Abstracts Views on Vision4Press platform.
Data correspond to usage on the plateform after 2015. The current usage metrics is available 48-96 hours after online publication and is updated daily on week days.
Initial download of the metrics may take a while.