Fig. 5.
Download original image
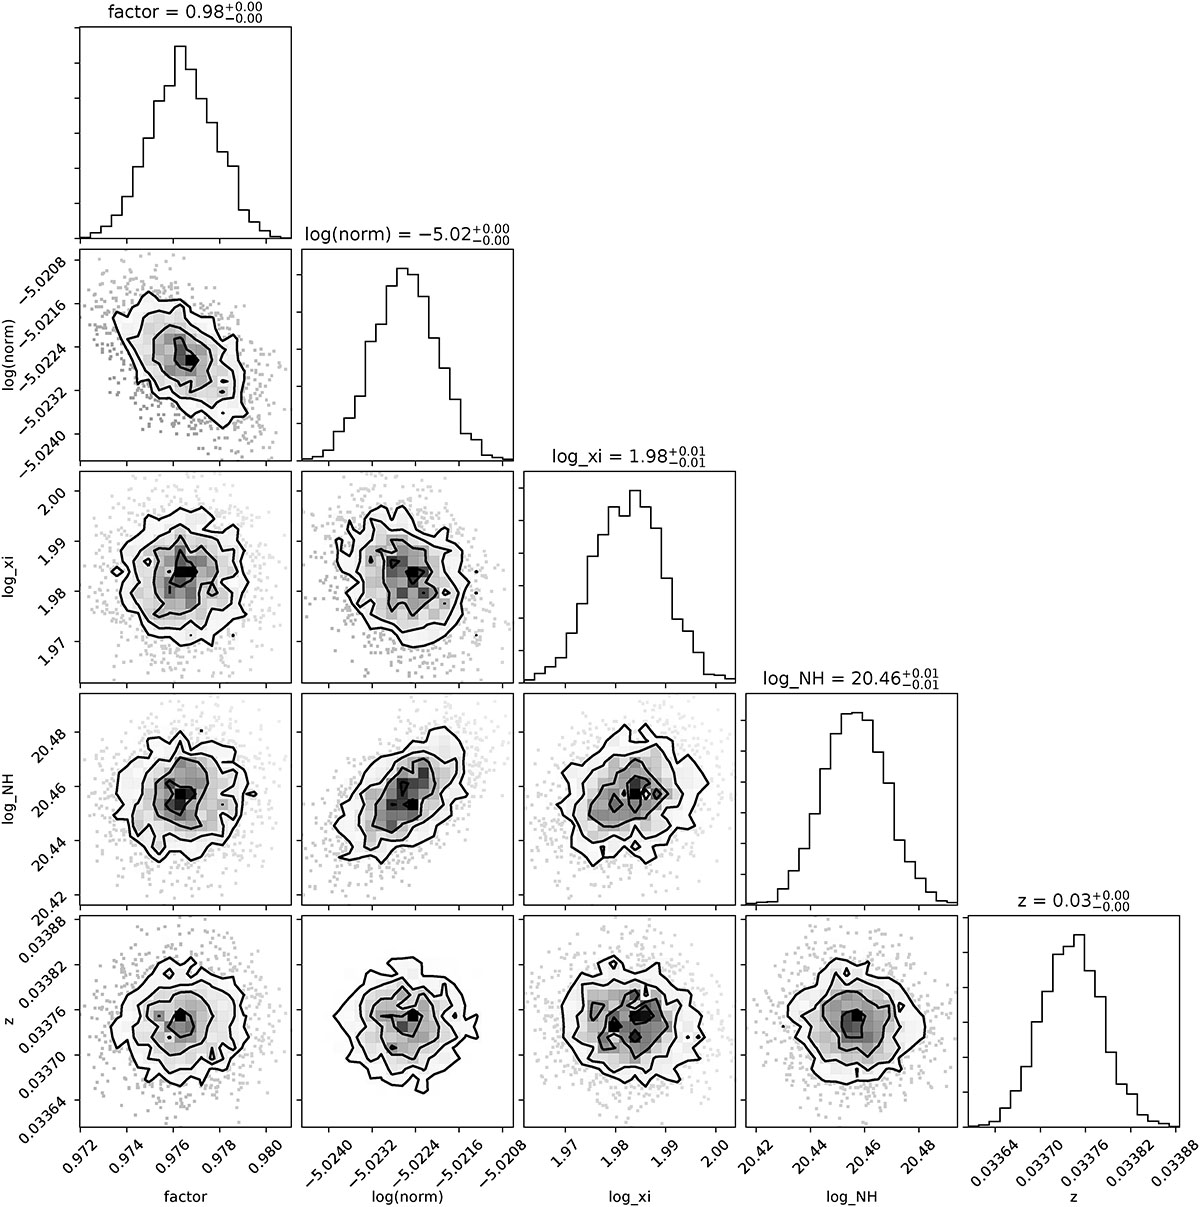
BXA contour plots for fit parameters of the total model to the Mrk 509 RGS 1 and RGS 2 spectra. The cross-normalization factor shows the difference between two RGS specra where normalization gives the position of the total model. Best fit log ![]() and log NH = 20.456 ± 0.016 with z = 0.03374 ± 0.00005 corresponds to the WA outflowing with v = 195 ± 16 km s−1. The diagonal panels show marginalized posterior probability distributions, while off-diagonal panels indicate conditional probability distribution functions among each parameter.
and log NH = 20.456 ± 0.016 with z = 0.03374 ± 0.00005 corresponds to the WA outflowing with v = 195 ± 16 km s−1. The diagonal panels show marginalized posterior probability distributions, while off-diagonal panels indicate conditional probability distribution functions among each parameter.
Current usage metrics show cumulative count of Article Views (full-text article views including HTML views, PDF and ePub downloads, according to the available data) and Abstracts Views on Vision4Press platform.
Data correspond to usage on the plateform after 2015. The current usage metrics is available 48-96 hours after online publication and is updated daily on week days.
Initial download of the metrics may take a while.