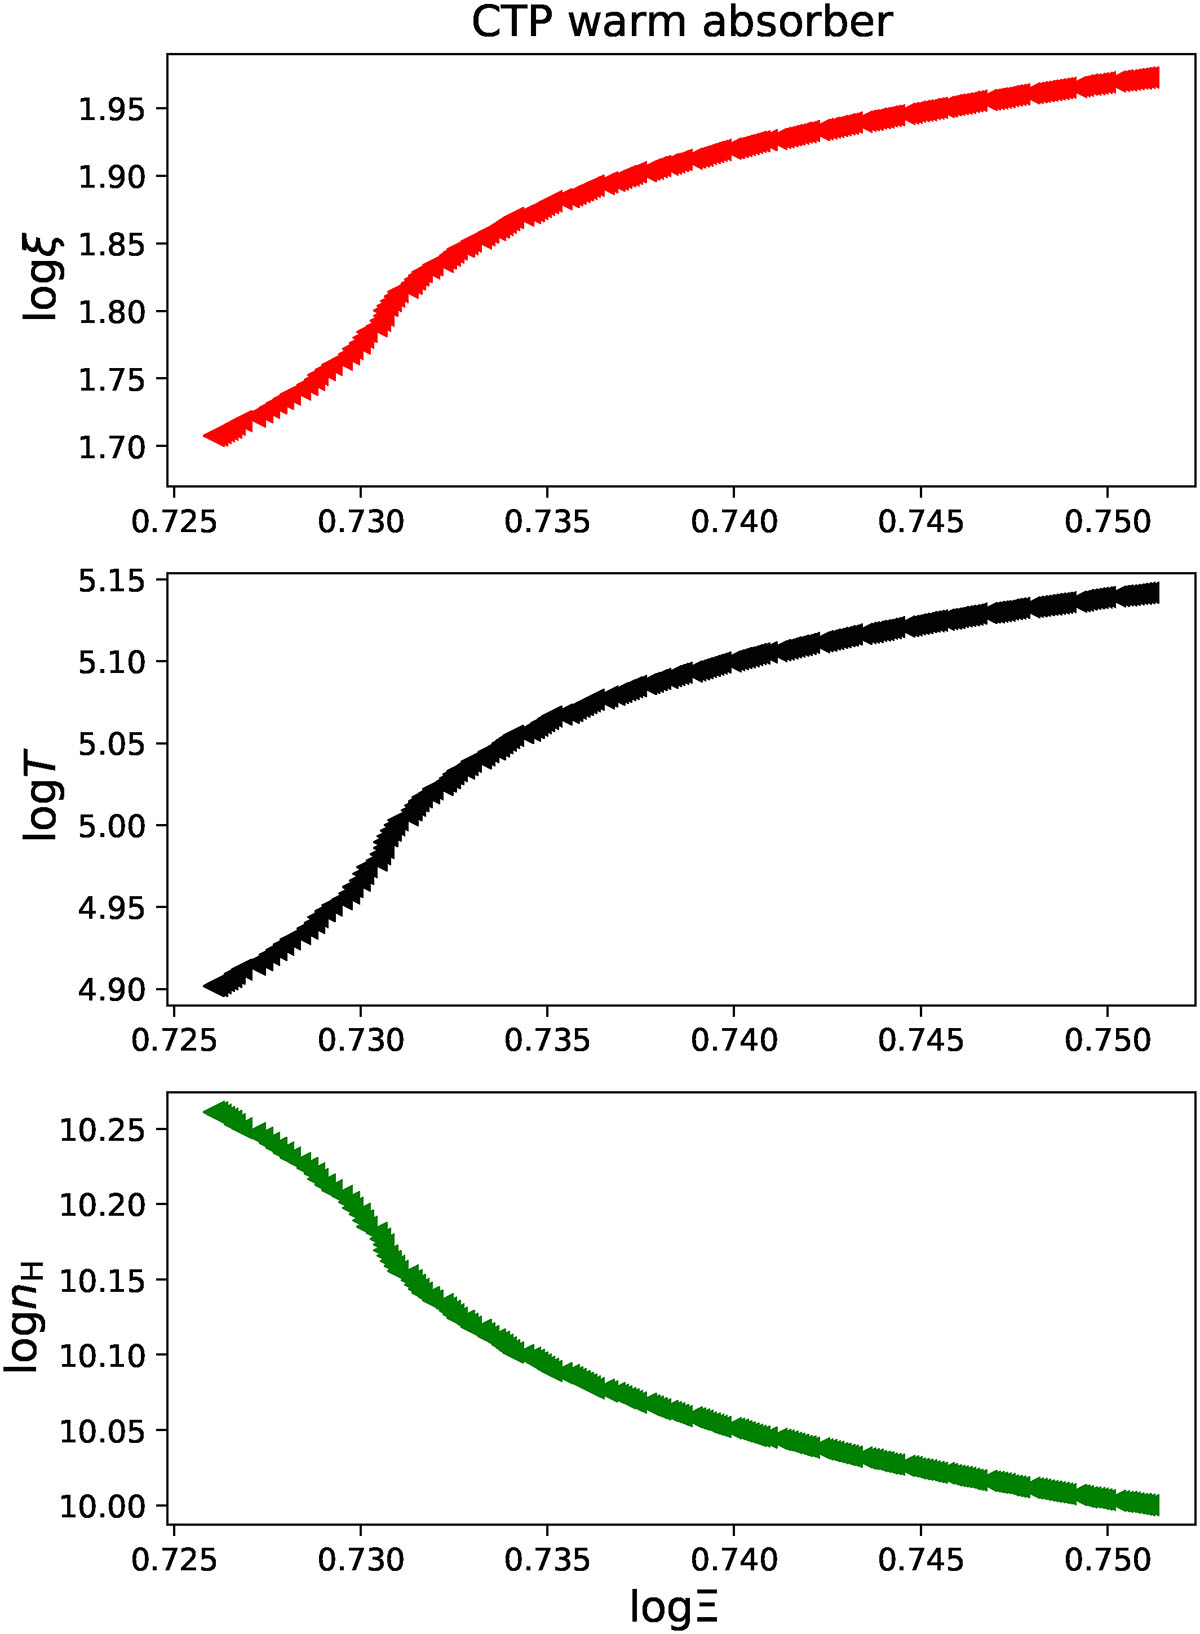
Fig. 6.
Download original image
Ionization structure of the best-fit CTP model computed by TITAN and fit to the Mrk 509 RGS data. The upper panel shows the structure of ionization parameter ξ, the medium panel the temperature, T (S-curve), and the bottom panel the volume density, nH, all versus the dynamical ionization parameter, Ξ. The illuminated cloud surface is located on the right side of the panels.
Current usage metrics show cumulative count of Article Views (full-text article views including HTML views, PDF and ePub downloads, according to the available data) and Abstracts Views on Vision4Press platform.
Data correspond to usage on the plateform after 2015. The current usage metrics is available 48-96 hours after online publication and is updated daily on week days.
Initial download of the metrics may take a while.