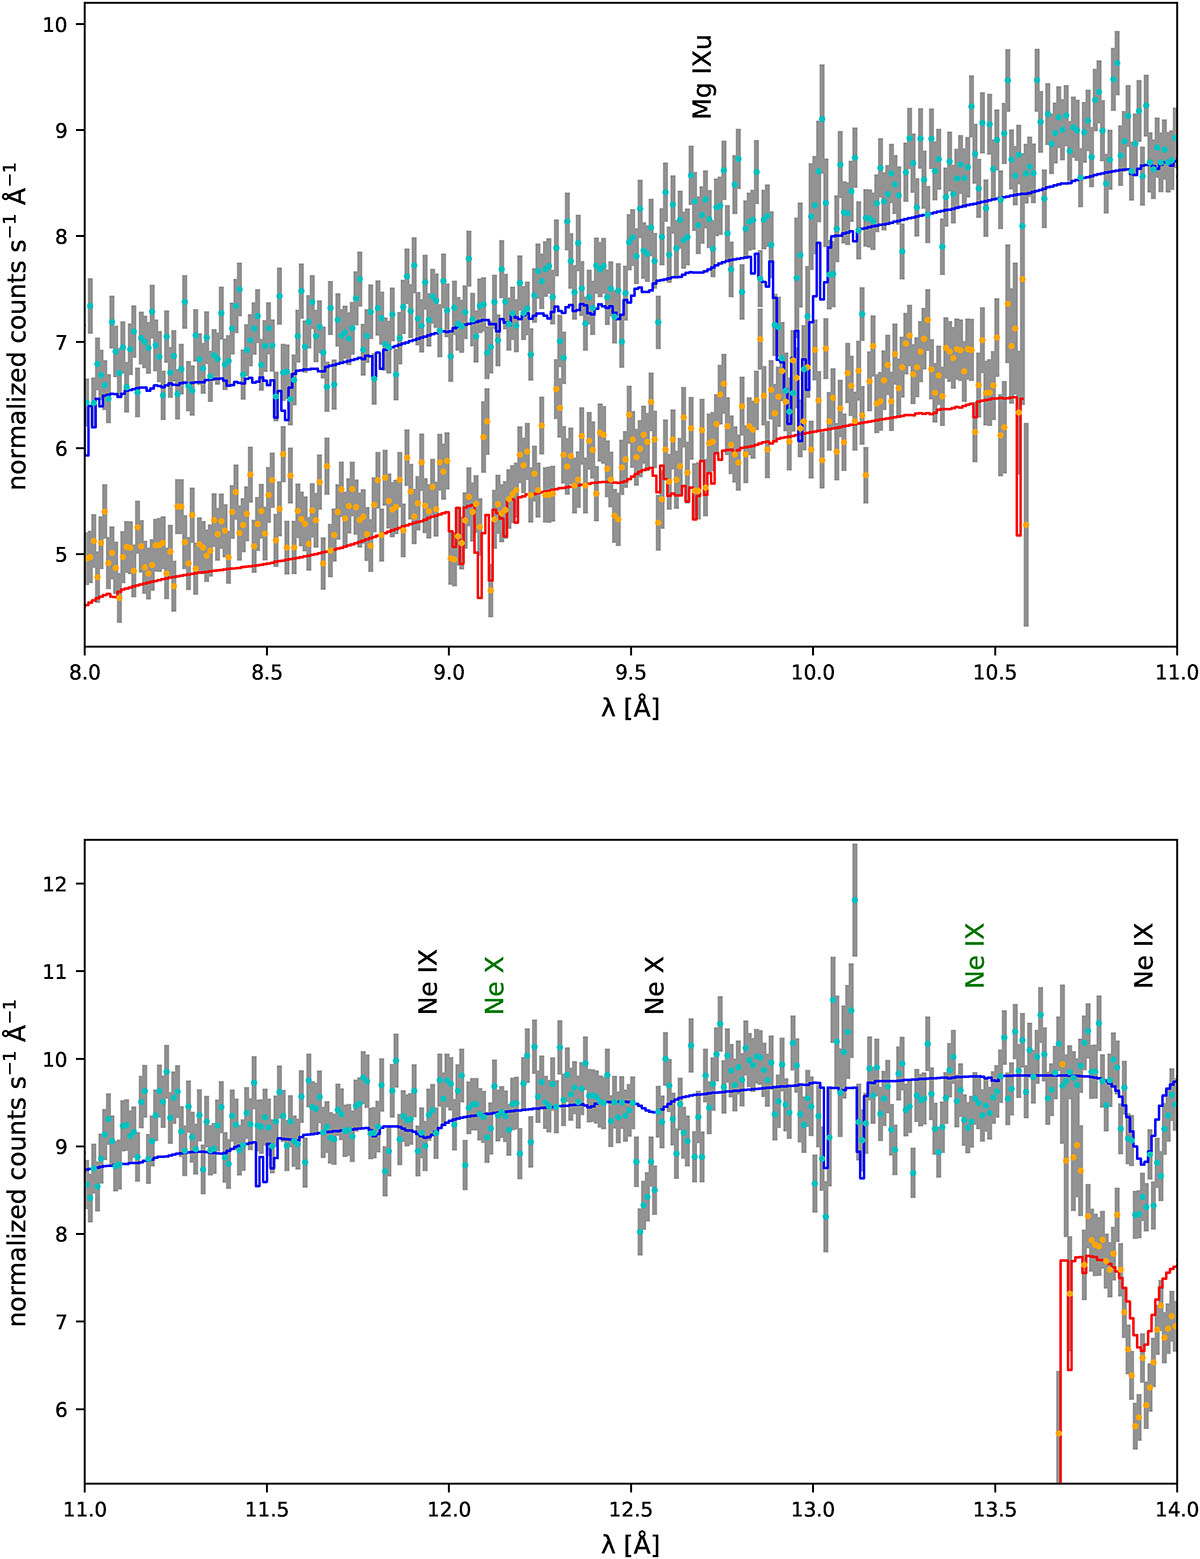
Fig. A.1.
Download original image
Overall model fit to Mrk 509 RGS spectrum given in observed frame. RGS 1 and RGS 2 spectra are plotted in orange and cyan dots with arbitrary shift 0.02 counts s−1 Å−1, and errors marked by gray bars. The total model: continuum together with single CTP WA is plotted in red and blue. WA lines are identified with black text, while possible absorption lines on Milky Way - by green text. For instrumental lines, see Appendix A.
Current usage metrics show cumulative count of Article Views (full-text article views including HTML views, PDF and ePub downloads, according to the available data) and Abstracts Views on Vision4Press platform.
Data correspond to usage on the plateform after 2015. The current usage metrics is available 48-96 hours after online publication and is updated daily on week days.
Initial download of the metrics may take a while.