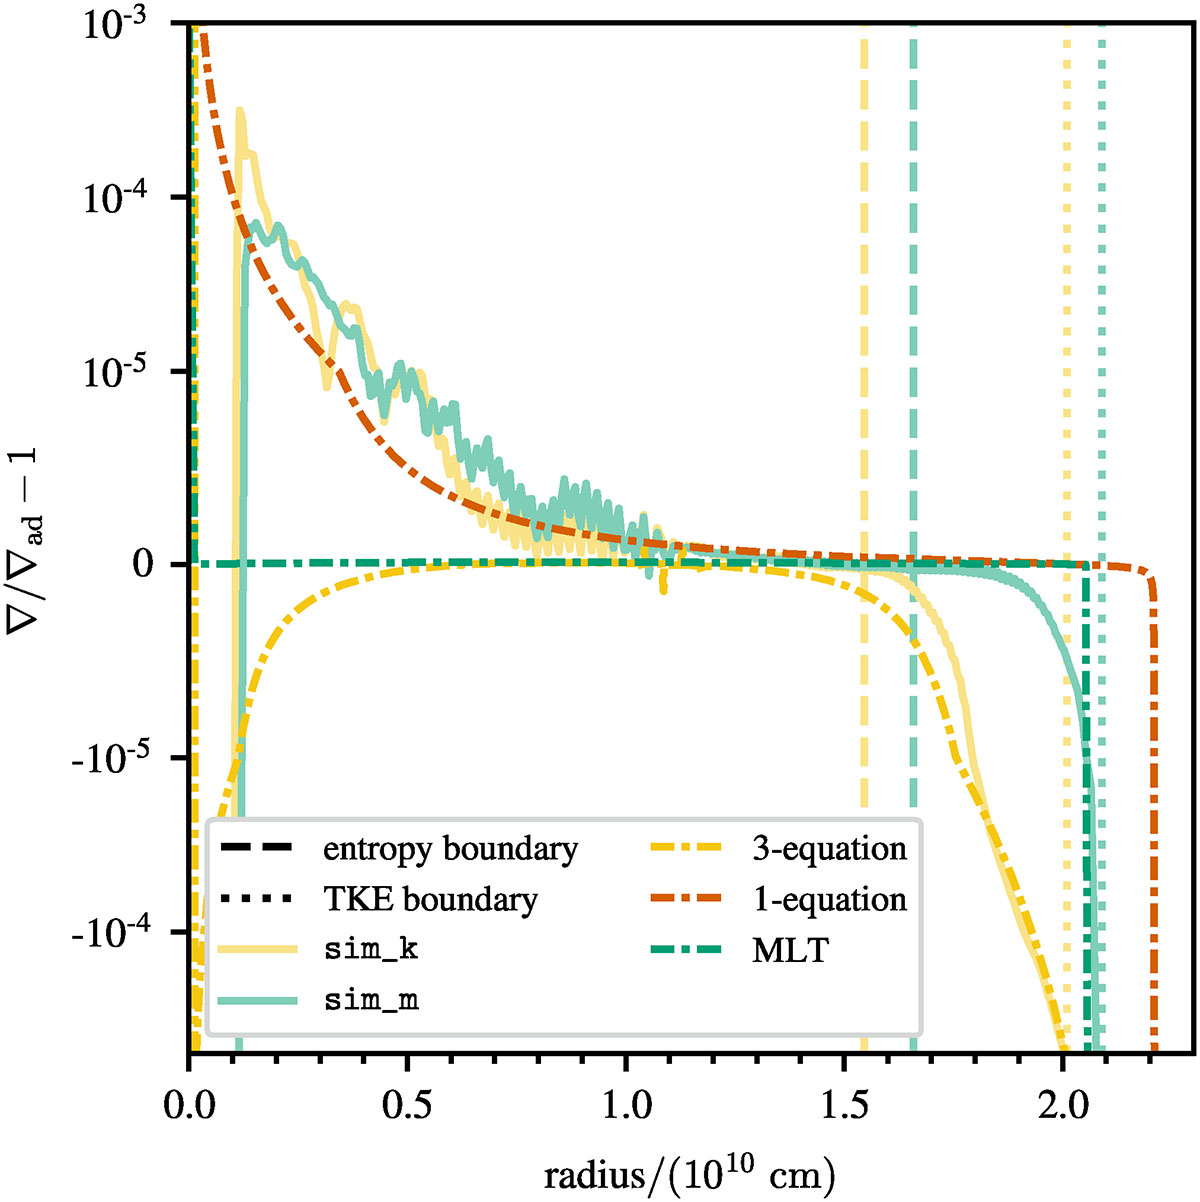
Fig. 1.
Download original image
Time-averaged superadiabaticity of the simulations (solid lines) and the initial models (dot-dashed lines). The dot-dashed orange line shows the superadiabaticity of the 1-equation model for comparison. The vertical dashed and dotted lines indicate the position of the entropy and TKE boundary (for definitions, see Sect. 4.1), respectively.
Current usage metrics show cumulative count of Article Views (full-text article views including HTML views, PDF and ePub downloads, according to the available data) and Abstracts Views on Vision4Press platform.
Data correspond to usage on the plateform after 2015. The current usage metrics is available 48-96 hours after online publication and is updated daily on week days.
Initial download of the metrics may take a while.