Fig. 18.
Download original image
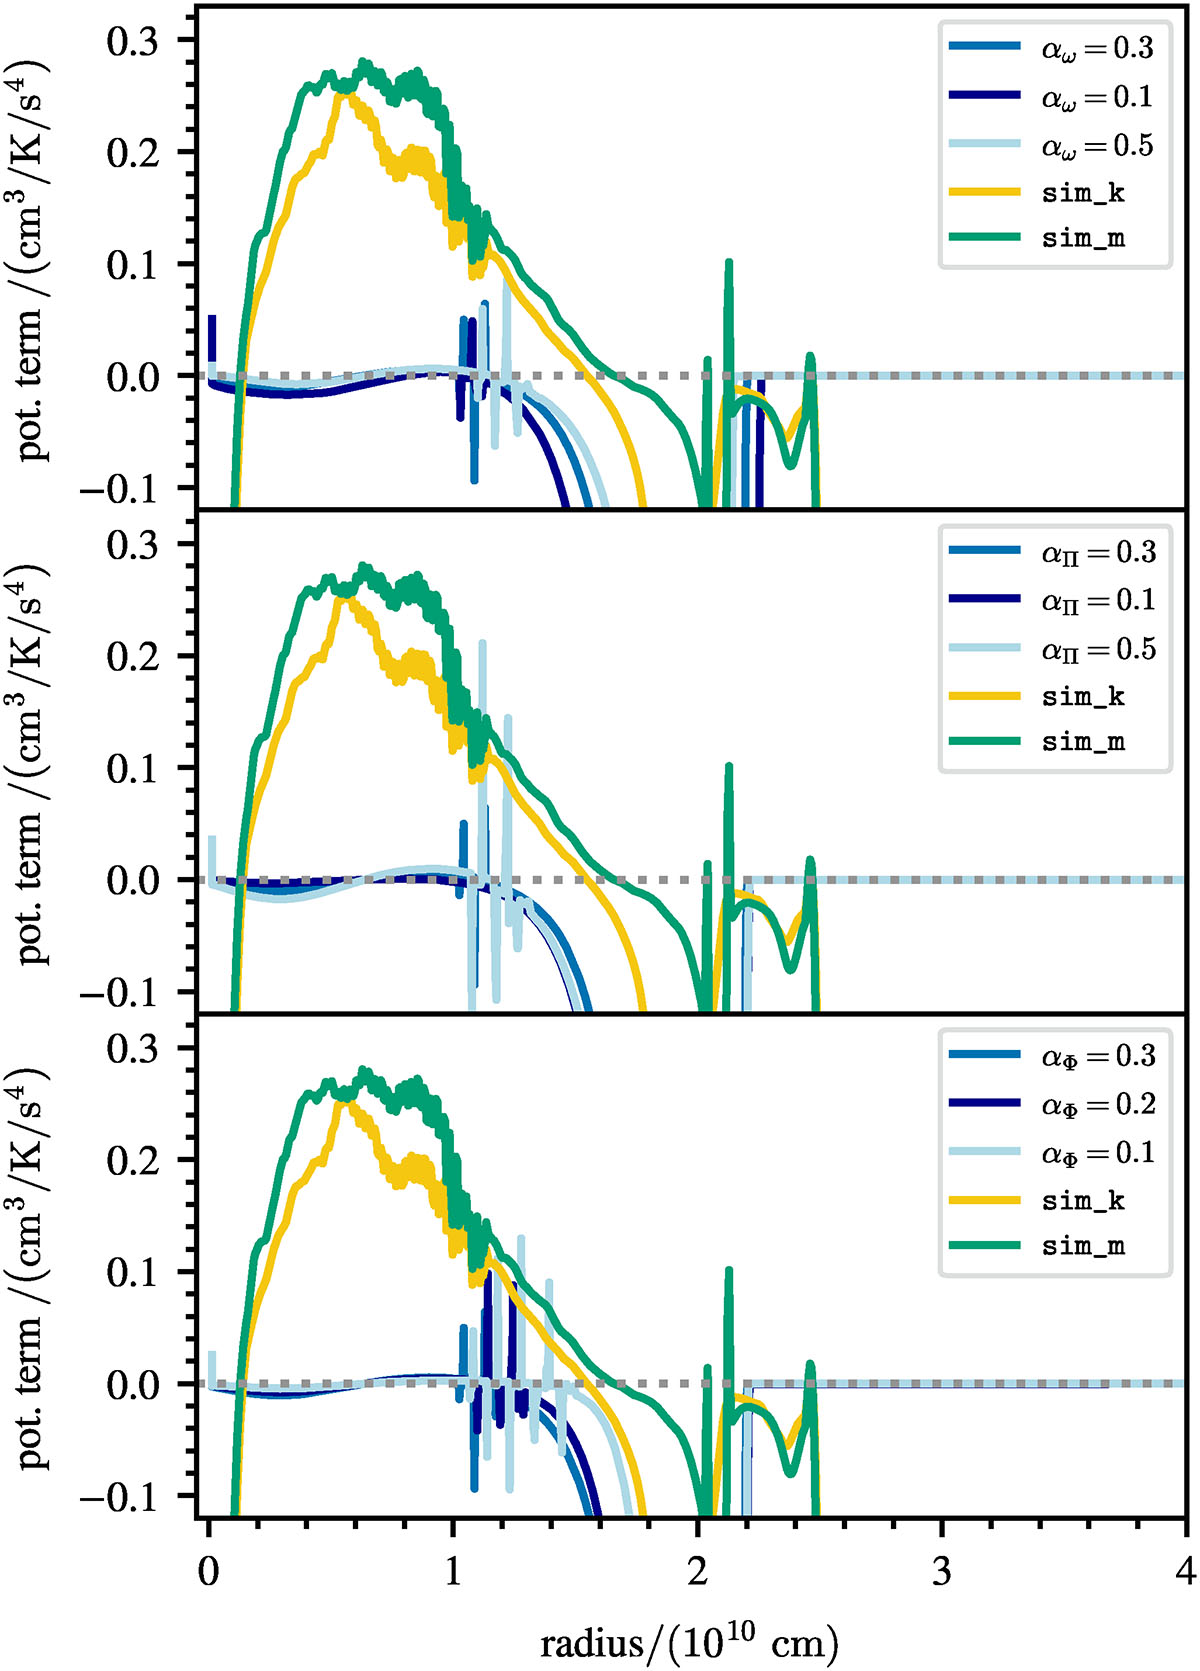
Comparison of potential terms of the convective flux equation of the 3-equation model as a function of radius. The results of the sim_k and sim_m simulation are shown with a yellow and green line, respectively. The potential terms of the convective flux equation obtained from the 3-equation model are shown with the remaining coloured lines (see legend for details). The parameters αω, αΠ and αΦ are varied in the upper, middle and lower panel respectively. The mid-blue line indicates the default parameter values.
Current usage metrics show cumulative count of Article Views (full-text article views including HTML views, PDF and ePub downloads, according to the available data) and Abstracts Views on Vision4Press platform.
Data correspond to usage on the plateform after 2015. The current usage metrics is available 48-96 hours after online publication and is updated daily on week days.
Initial download of the metrics may take a while.