Fig. B.1.
Download original image
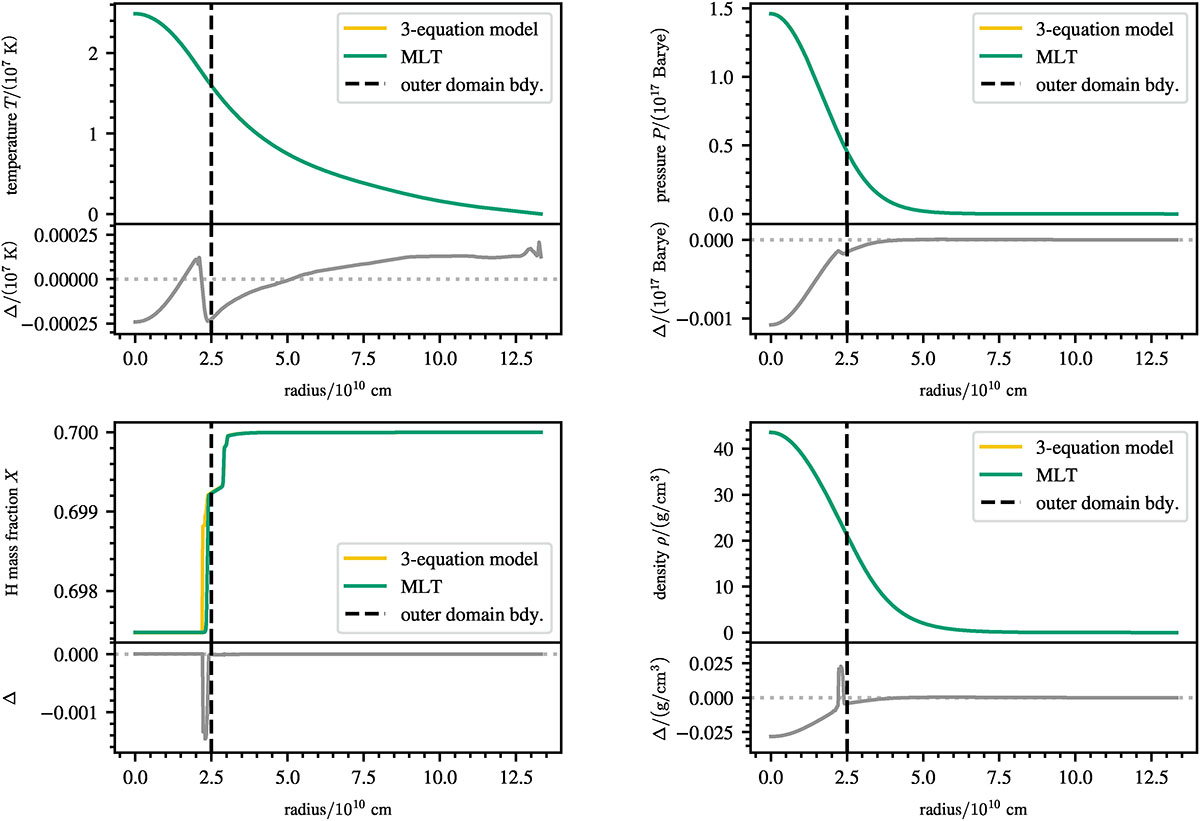
Comparison of the stellar structures of the initial models of the sim_k and sim_m simulation. Results for the 3-equation model and the MLT model are shown in yellow and green, respectively. We show the temperature, pressure, hydrogen and density profiles from top left to lower right. The difference between the two initial models is shown in the small panels below the profiles. The initial thermal stratifications can be found in Fig. 1. We note that the green and yellow lines largely overlap due to the similarity of the initial stellar models.
Current usage metrics show cumulative count of Article Views (full-text article views including HTML views, PDF and ePub downloads, according to the available data) and Abstracts Views on Vision4Press platform.
Data correspond to usage on the plateform after 2015. The current usage metrics is available 48-96 hours after online publication and is updated daily on week days.
Initial download of the metrics may take a while.