Open Access
Fig. 2.
Download original image
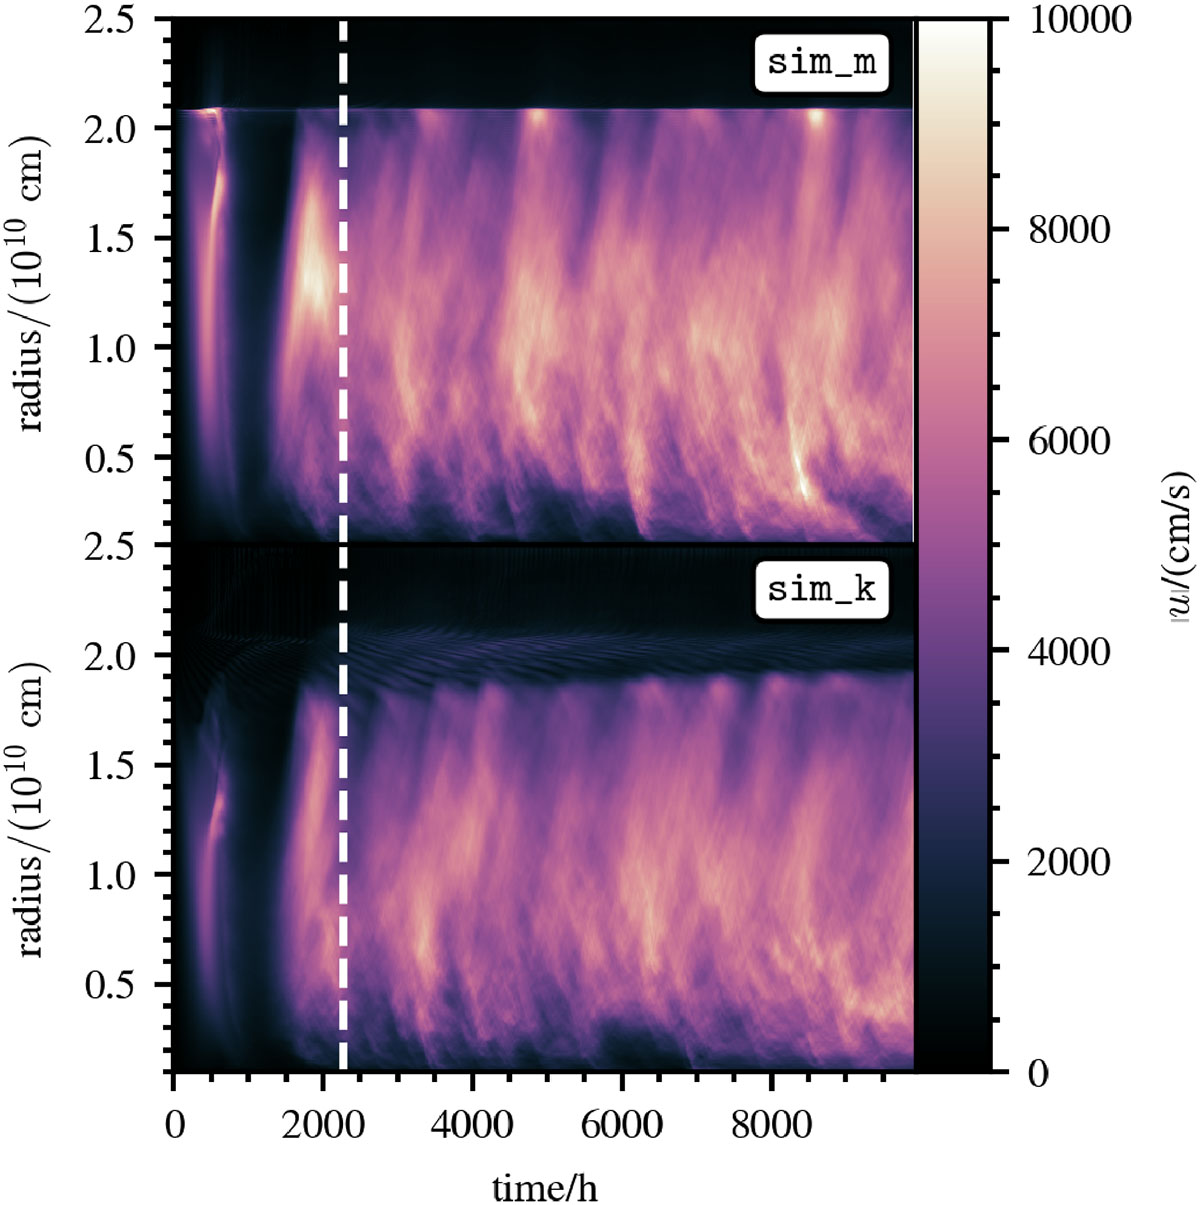
Time evolution of the angularly averaged velocity profile. The top and bottom panels show the sim_m simulation and the sim_k simulation, respectively. The end of the initial transient phase is indicated with a vertical dashed white line.
Current usage metrics show cumulative count of Article Views (full-text article views including HTML views, PDF and ePub downloads, according to the available data) and Abstracts Views on Vision4Press platform.
Data correspond to usage on the plateform after 2015. The current usage metrics is available 48-96 hours after online publication and is updated daily on week days.
Initial download of the metrics may take a while.