Fig. D.1.
Download original image
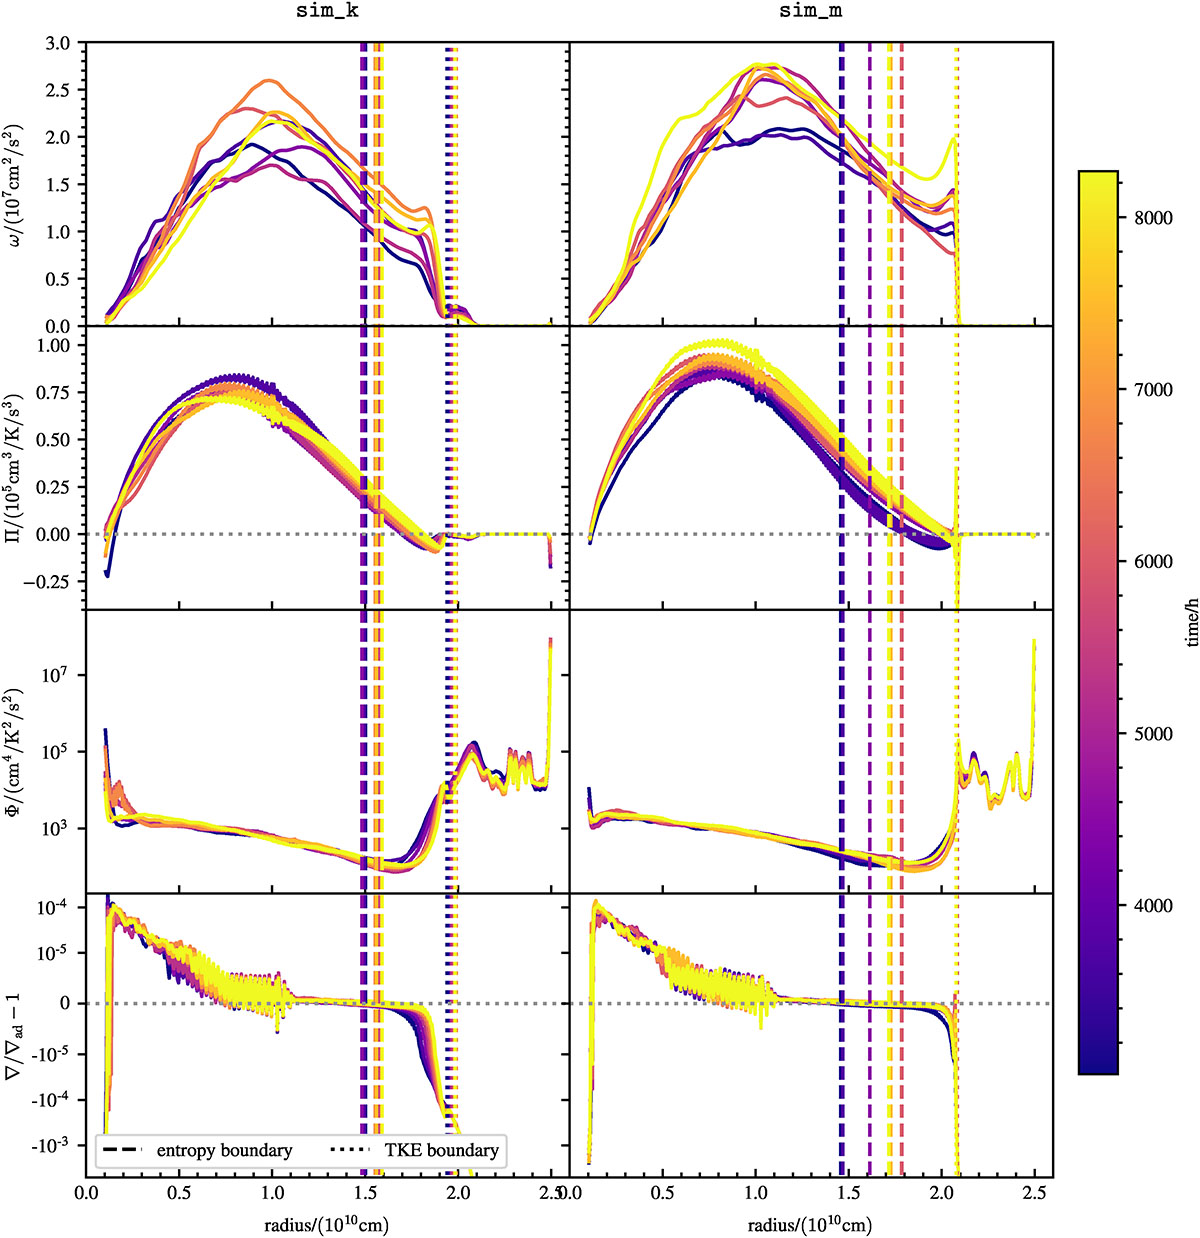
Analysis of Reynolds averages for the identical length (1500 h) averaging windows, centred at different times. The results of the sim_k and sim_m simulation are given in the left and right panel, respectively. The TKE ω, convective flux variable Π, entropy fluctuation variable Φ and the superadiabaticity are shown from top to bottom. The entropy and TKE boundaries are shown with the dashed and dotted lines, respectively. The colour code correspond to the central time of the averaging windows.
Current usage metrics show cumulative count of Article Views (full-text article views including HTML views, PDF and ePub downloads, according to the available data) and Abstracts Views on Vision4Press platform.
Data correspond to usage on the plateform after 2015. The current usage metrics is available 48-96 hours after online publication and is updated daily on week days.
Initial download of the metrics may take a while.