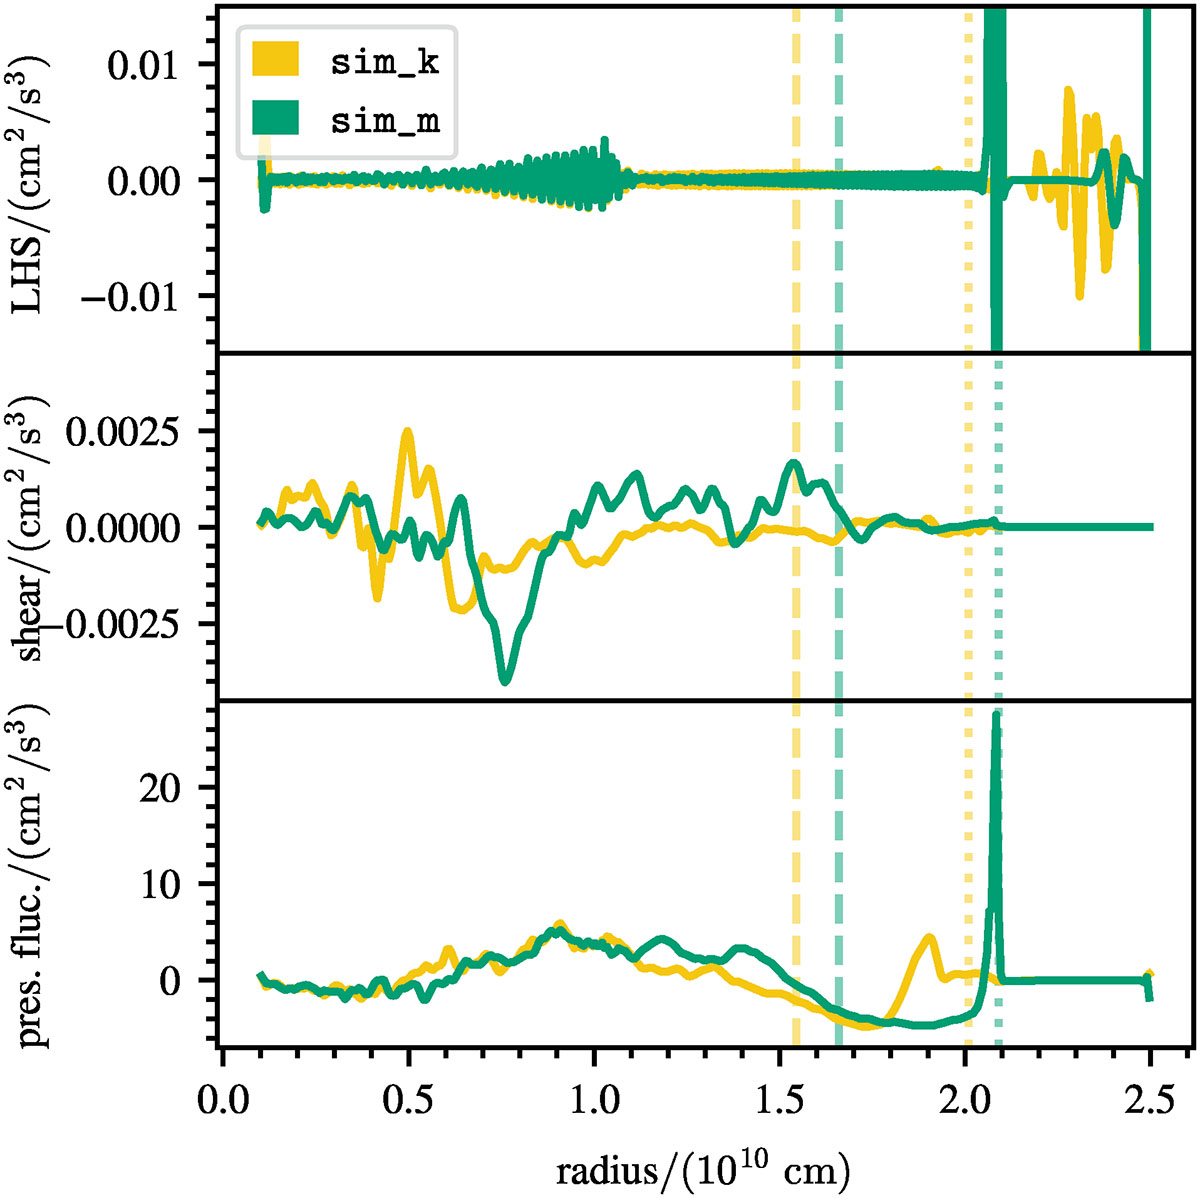
Fig. G.2.
Download original image
Comparison of terms neglected in the TKE equation of the Kuhfuß model as a function of radius. The upper panel shows the left hand side of the equation, the middle panels shows the shear term and the lower panel shows the pressure fluctuation terms. The results of the sim_k and sim_m simulation are shown with yellow and green lines, respectively. We indicate the entropy and TKE boundaries with dashed and dotted lines in the respective colour.
Current usage metrics show cumulative count of Article Views (full-text article views including HTML views, PDF and ePub downloads, according to the available data) and Abstracts Views on Vision4Press platform.
Data correspond to usage on the plateform after 2015. The current usage metrics is available 48-96 hours after online publication and is updated daily on week days.
Initial download of the metrics may take a while.