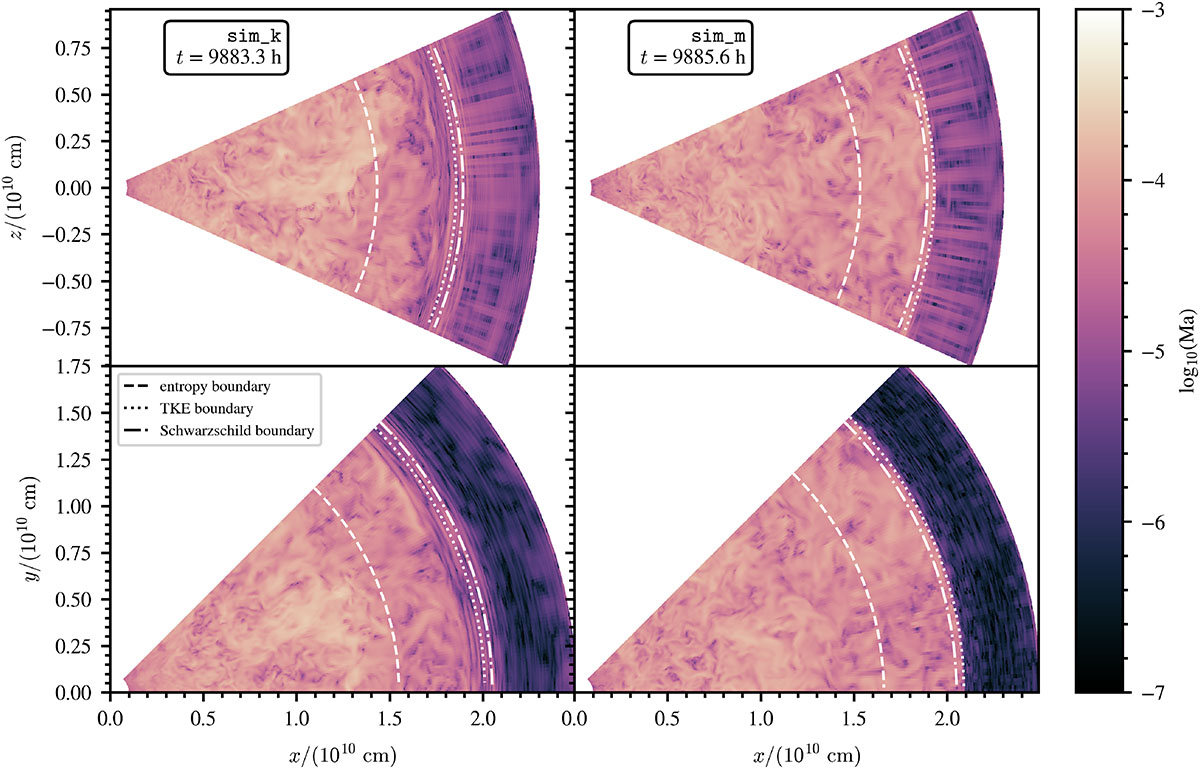
Fig. 3.
Download original image
Visualisation of the convective flow from the 3D simulations in the x–z and the x–y plane using the Mach number of the flow in the upper and lower panel, respectively. The results from the sim_k simulation are shown in the left column and the results from the sim_m simulation are shown in the right column. The Mach number is indicated with the logarithmic colour-scale. The Schwarzschild boundary of the initial stellar models is indicated with a white dash-dotted line in each panel. We further indicate the entropy and TKE boundary of each simulation with the dashed and dotted white lines (see Sect. 4.1 and Table 1 for details). The upper row shows the raw simulation data, while a radial smoothing has been applied to the flow velocities in the bottom row (see text). The Cartesian coordinates x, y, z are obtained from the conventional conversion of the spherical coordinates r, θ, ϕ of the simulation grid.
Current usage metrics show cumulative count of Article Views (full-text article views including HTML views, PDF and ePub downloads, according to the available data) and Abstracts Views on Vision4Press platform.
Data correspond to usage on the plateform after 2015. The current usage metrics is available 48-96 hours after online publication and is updated daily on week days.
Initial download of the metrics may take a while.