Open Access
Fig. 11
Download original image
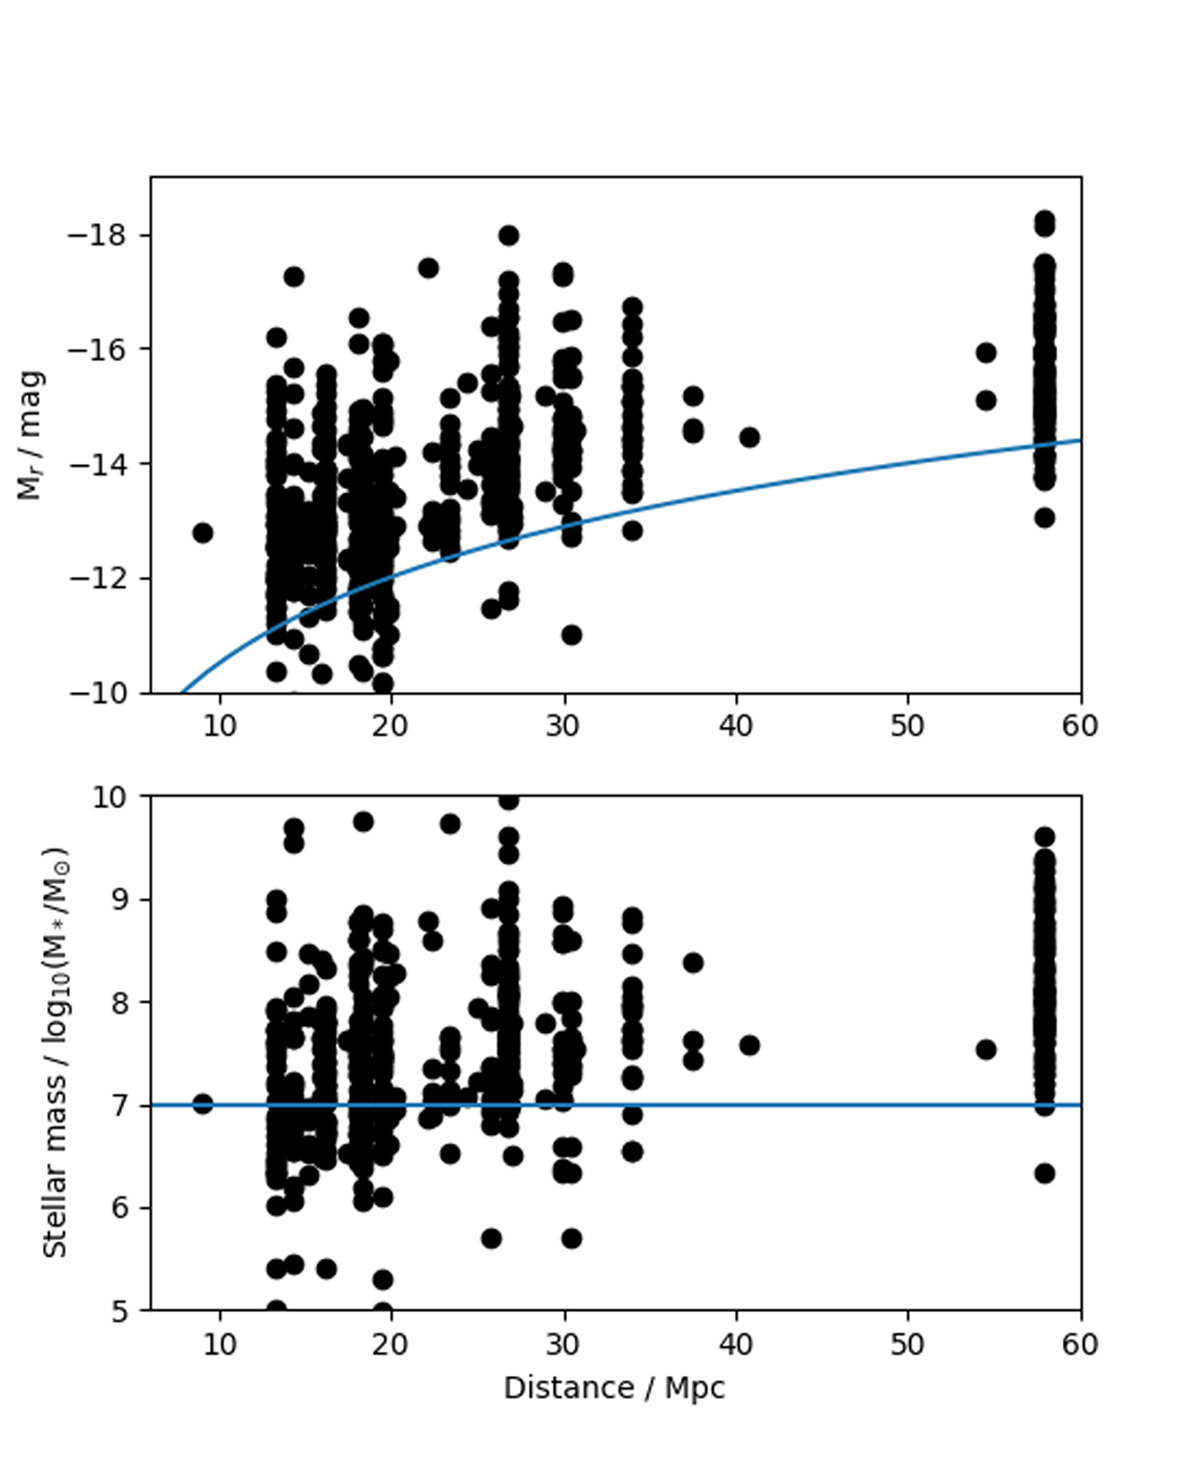
Distribution of the absolute magnitudes (upper panel) and stellar masses (lower panel) of the dwarf candidates as a function of the associated groups’ distance. The blue lines in the upper and lower panels show the completeness limit of the detections and the stellar mass limit used, respectively.
Current usage metrics show cumulative count of Article Views (full-text article views including HTML views, PDF and ePub downloads, according to the available data) and Abstracts Views on Vision4Press platform.
Data correspond to usage on the plateform after 2015. The current usage metrics is available 48-96 hours after online publication and is updated daily on week days.
Initial download of the metrics may take a while.