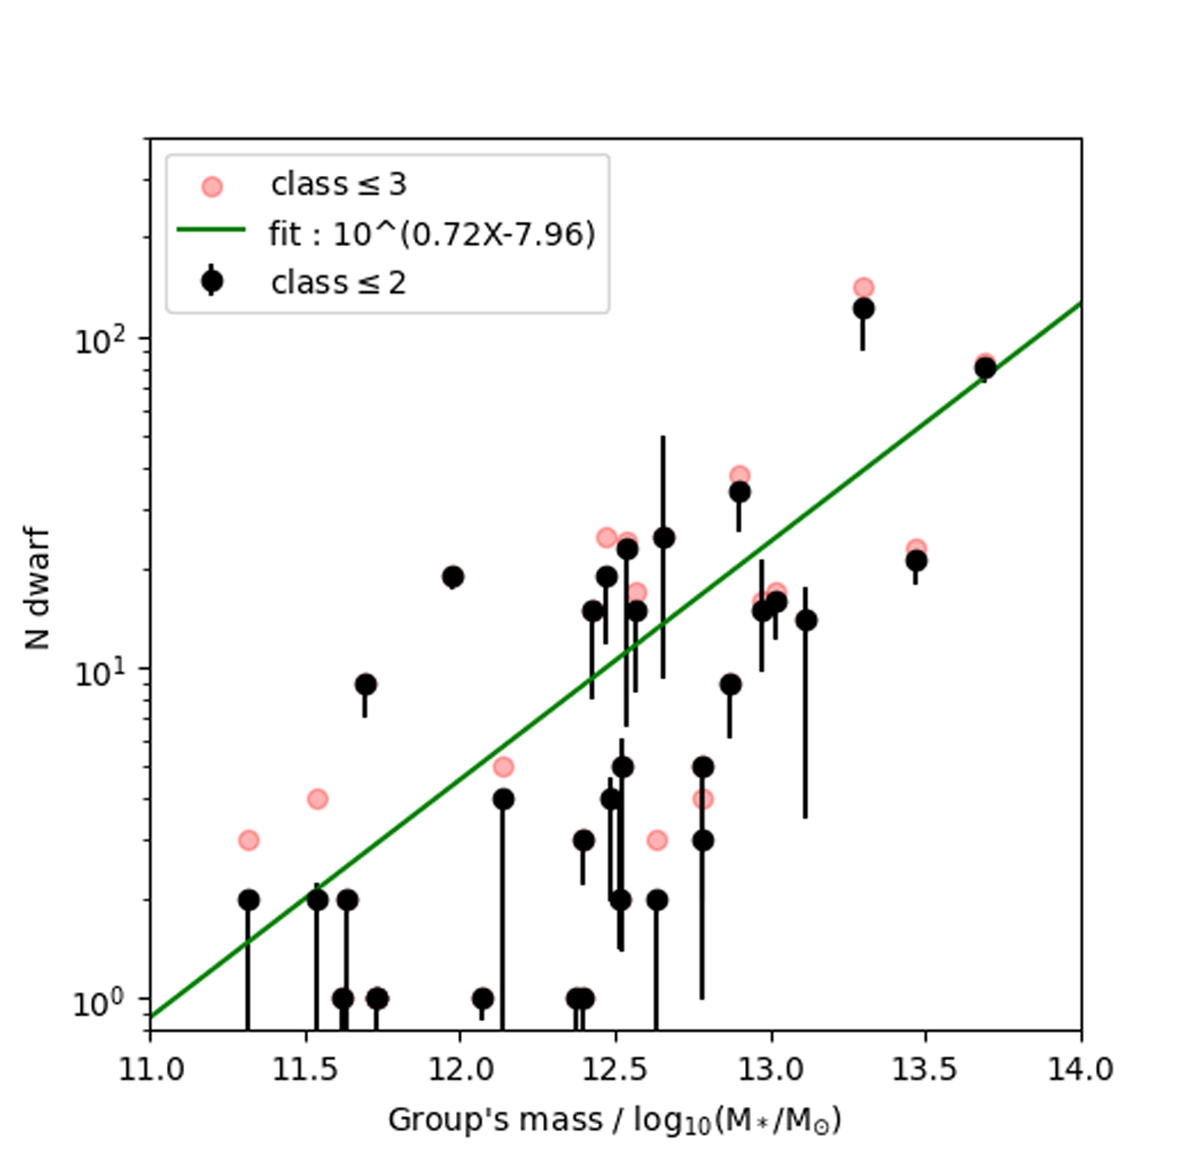
Fig. 12
Download original image
Number of dwarf candidates as a function of group’s mass. The black and red symbols show the number of candidates with morphological classes less or equal to 2 and 3, respectively. The black error bars show the uncertainty of the numbers: we obtained lower limits by estimating number of the objects whose projected locations are likely overlapping with the group by chance and the upper limits by extrapolating the number of dwarfs for the whole Rvir area in case of partially covered groups. The green line shows the linear fit to the data.
Current usage metrics show cumulative count of Article Views (full-text article views including HTML views, PDF and ePub downloads, according to the available data) and Abstracts Views on Vision4Press platform.
Data correspond to usage on the plateform after 2015. The current usage metrics is available 48-96 hours after online publication and is updated daily on week days.
Initial download of the metrics may take a while.