Fig. 2
Download original image
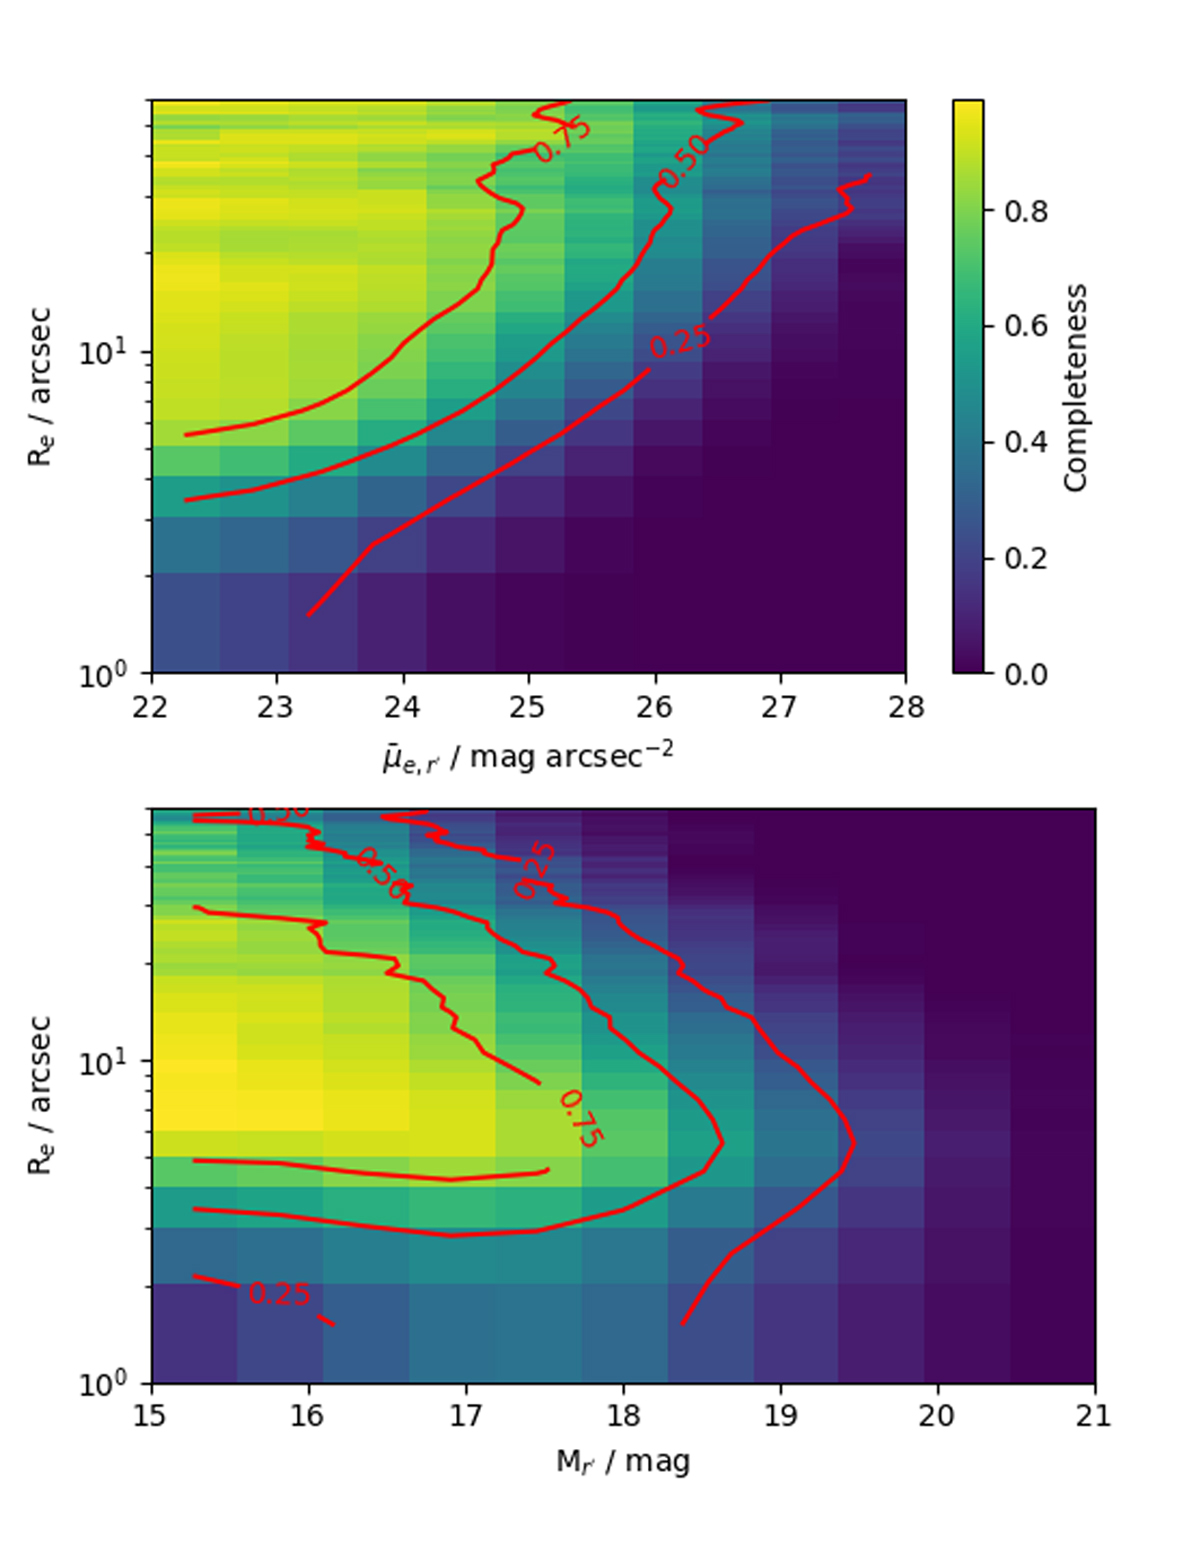
Completeness based on our detections and selection limits. The upper panel shows the input effective radii and mean effective surface brightness in the r′ band for artificial galaxies embedded in the KiDS images. The lower panel shows the input r′-band magnitude and effective radii. The colors in the images indicate the fraction of detected and selected galaxies in a given parameter space and the red lines show the 25, 50, and 75% completeness contours.
Current usage metrics show cumulative count of Article Views (full-text article views including HTML views, PDF and ePub downloads, according to the available data) and Abstracts Views on Vision4Press platform.
Data correspond to usage on the plateform after 2015. The current usage metrics is available 48-96 hours after online publication and is updated daily on week days.
Initial download of the metrics may take a while.