Open Access
Fig. 3
Download original image
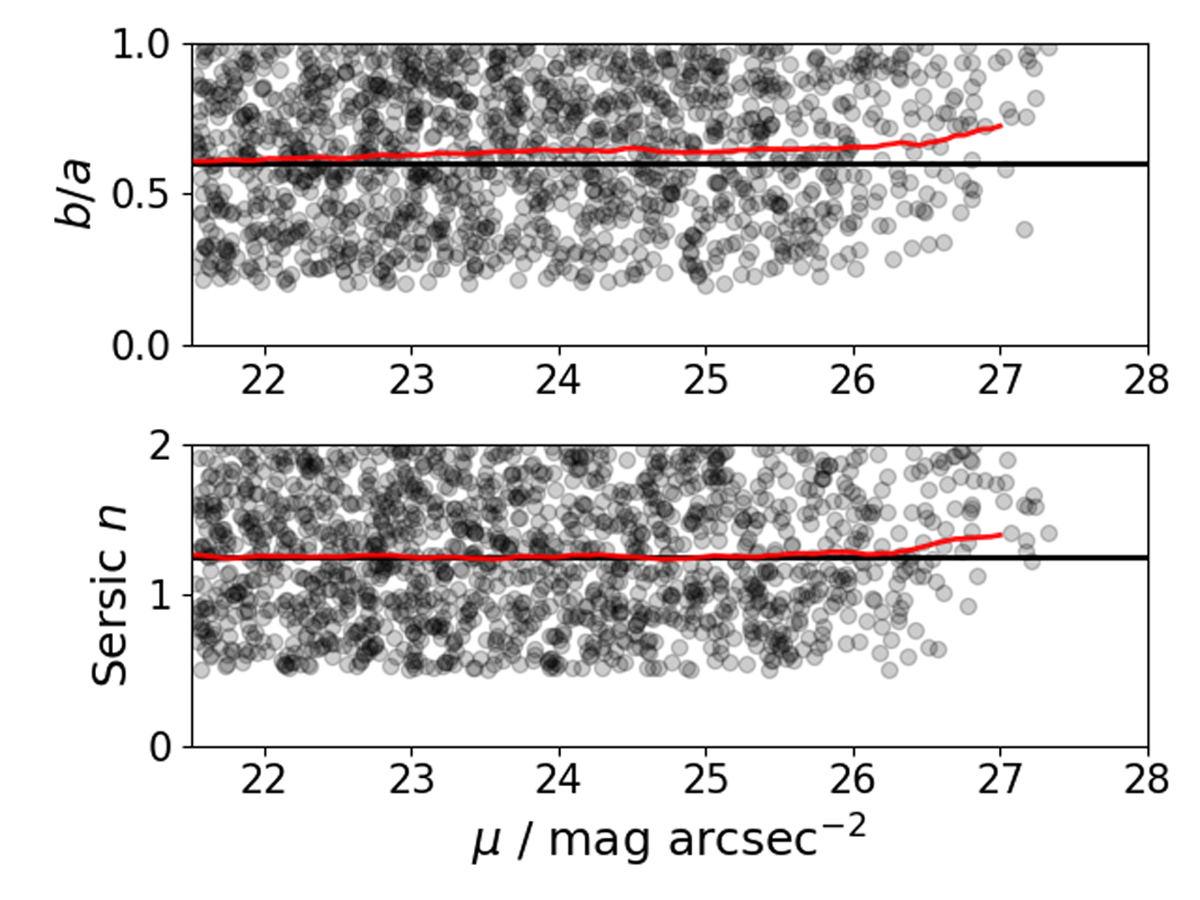
Distribution of the axis ratios (upper panel) and Sérsic indices (lower panel) of the simulated dwarfs detected with MTO as a function of the mean effective surface brightness in the r″ band. The black and red lines show the input mean and output running mean of the parameter distribution, respectively.
Current usage metrics show cumulative count of Article Views (full-text article views including HTML views, PDF and ePub downloads, according to the available data) and Abstracts Views on Vision4Press platform.
Data correspond to usage on the plateform after 2015. The current usage metrics is available 48-96 hours after online publication and is updated daily on week days.
Initial download of the metrics may take a while.