Fig. 4
Download original image
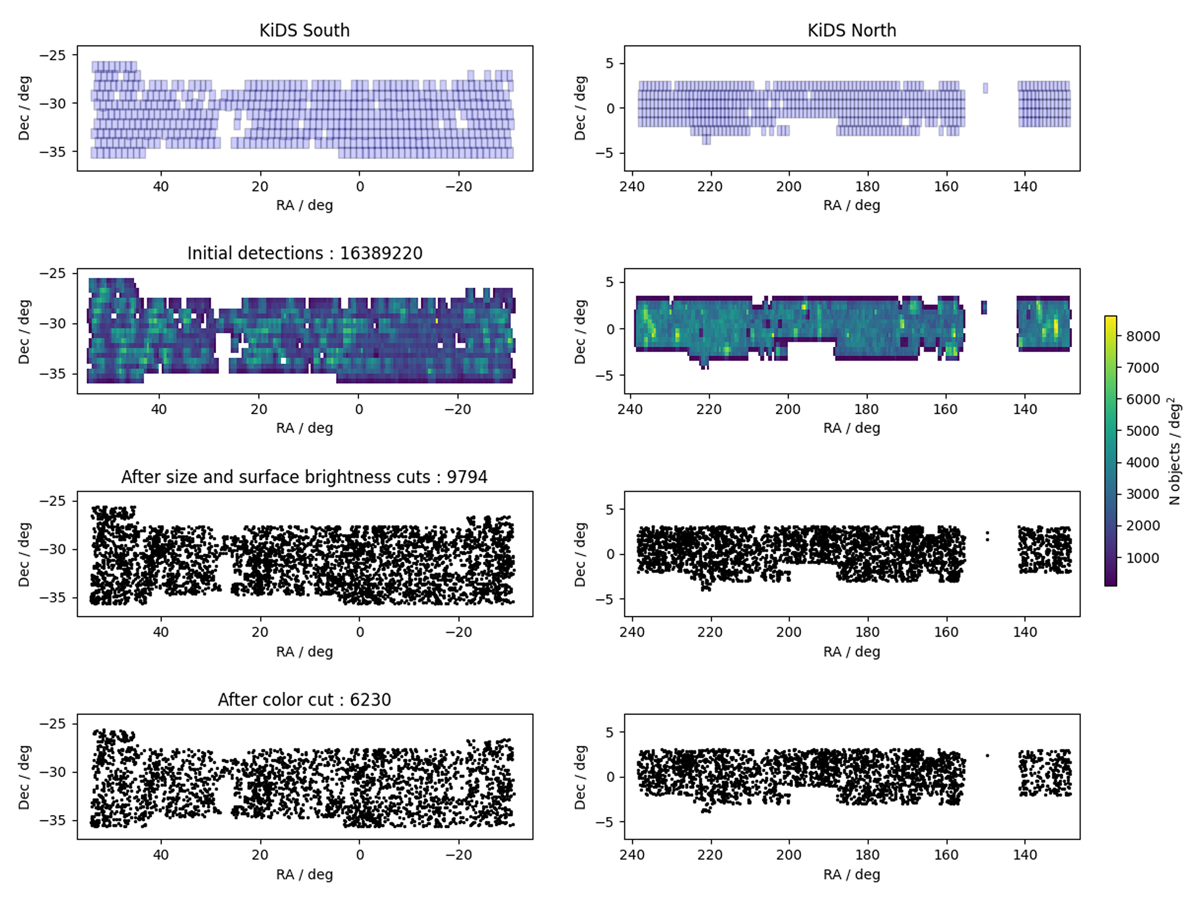
Distribution of the data and detections on the sky. The top panel shows the available KiDS exposures. The second panel from the top shows the number density of detections (the corresponding color bar is shown on the right). The third panel from the top shows the objects selected based on their detection size and surface brightness. The bottom panel shows the distribution of the detections when the color selection is also applied. The numbers above the panels indicate the number of objects left when the corresponding selection criteria are applied. The various selection criteria are described in the main text.
Current usage metrics show cumulative count of Article Views (full-text article views including HTML views, PDF and ePub downloads, according to the available data) and Abstracts Views on Vision4Press platform.
Data correspond to usage on the plateform after 2015. The current usage metrics is available 48-96 hours after online publication and is updated daily on week days.
Initial download of the metrics may take a while.