Open Access
Fig. 6
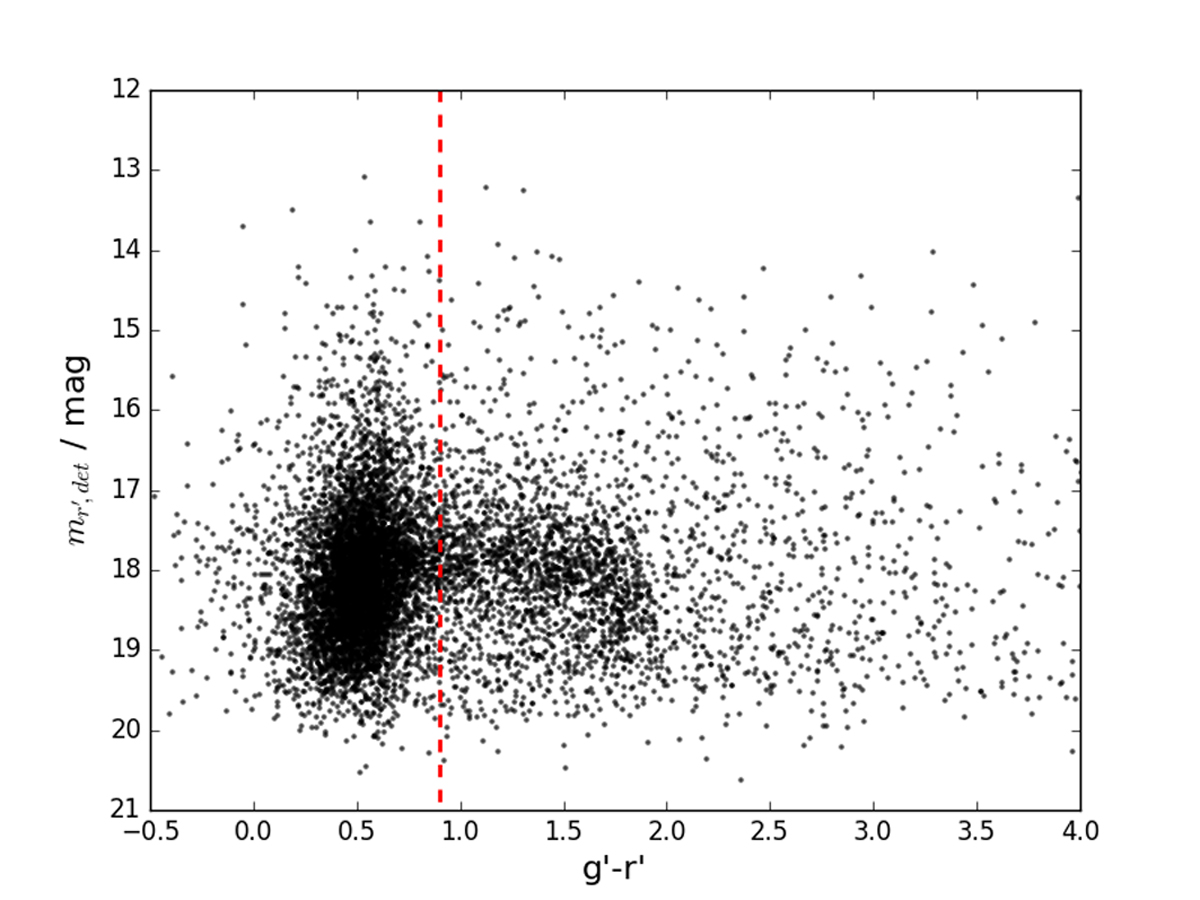
Download original image
Colors of size and SB selected objects. Black symbols show the g′ - r′ aperture colors and detection r′-band magnitudes for the objects selected based on their sizes and surface brightness. The dashed red line shows the selection limit adopted for the colors.
Current usage metrics show cumulative count of Article Views (full-text article views including HTML views, PDF and ePub downloads, according to the available data) and Abstracts Views on Vision4Press platform.
Data correspond to usage on the plateform after 2015. The current usage metrics is available 48-96 hours after online publication and is updated daily on week days.
Initial download of the metrics may take a while.