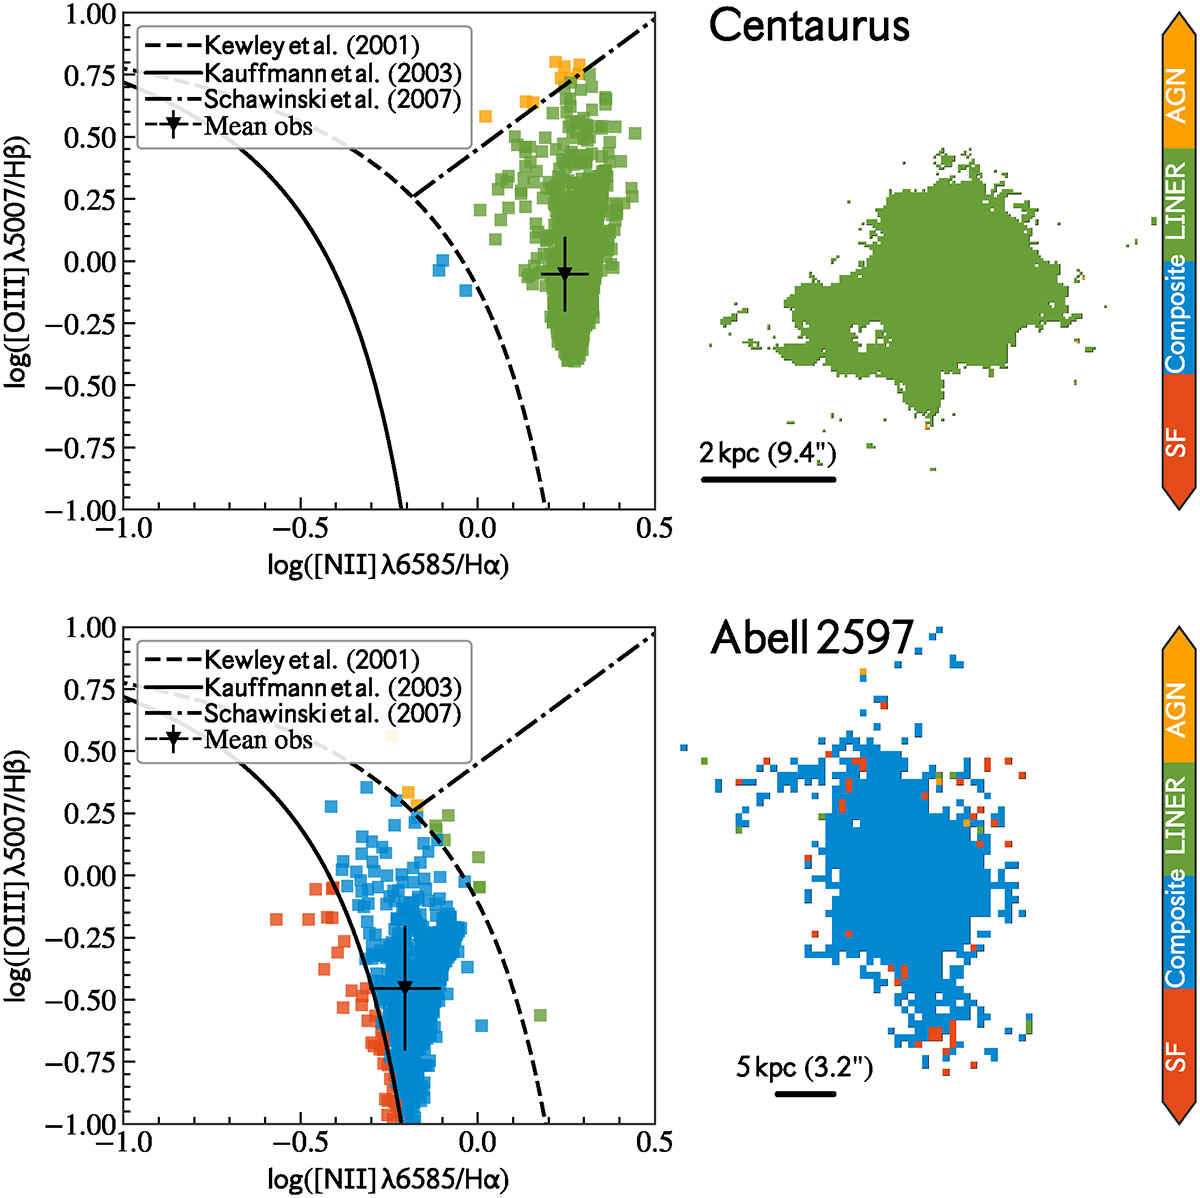
Fig. 2.
Download original image
Example of resolved BPT-NII classic diagrams for Centaurus (top panels), and Abell 2597 (bottom panels). Spaxels are color-coded based on their location relative to boundaries between the well-known empirical and theoretical classification schemes Kewley et al. (2001), Kauffmann et al. (2003), Schawinski et al. (2007) shown in solid, dashed, and pointed black lines, respectively. Yellow, green, blue, and red spaxels correspond to AGN-, LINER-, composite-, and HII-dominated regions, respectively.
Current usage metrics show cumulative count of Article Views (full-text article views including HTML views, PDF and ePub downloads, according to the available data) and Abstracts Views on Vision4Press platform.
Data correspond to usage on the plateform after 2015. The current usage metrics is available 48-96 hours after online publication and is updated daily on week days.
Initial download of the metrics may take a while.