Fig. 3.
Download original image
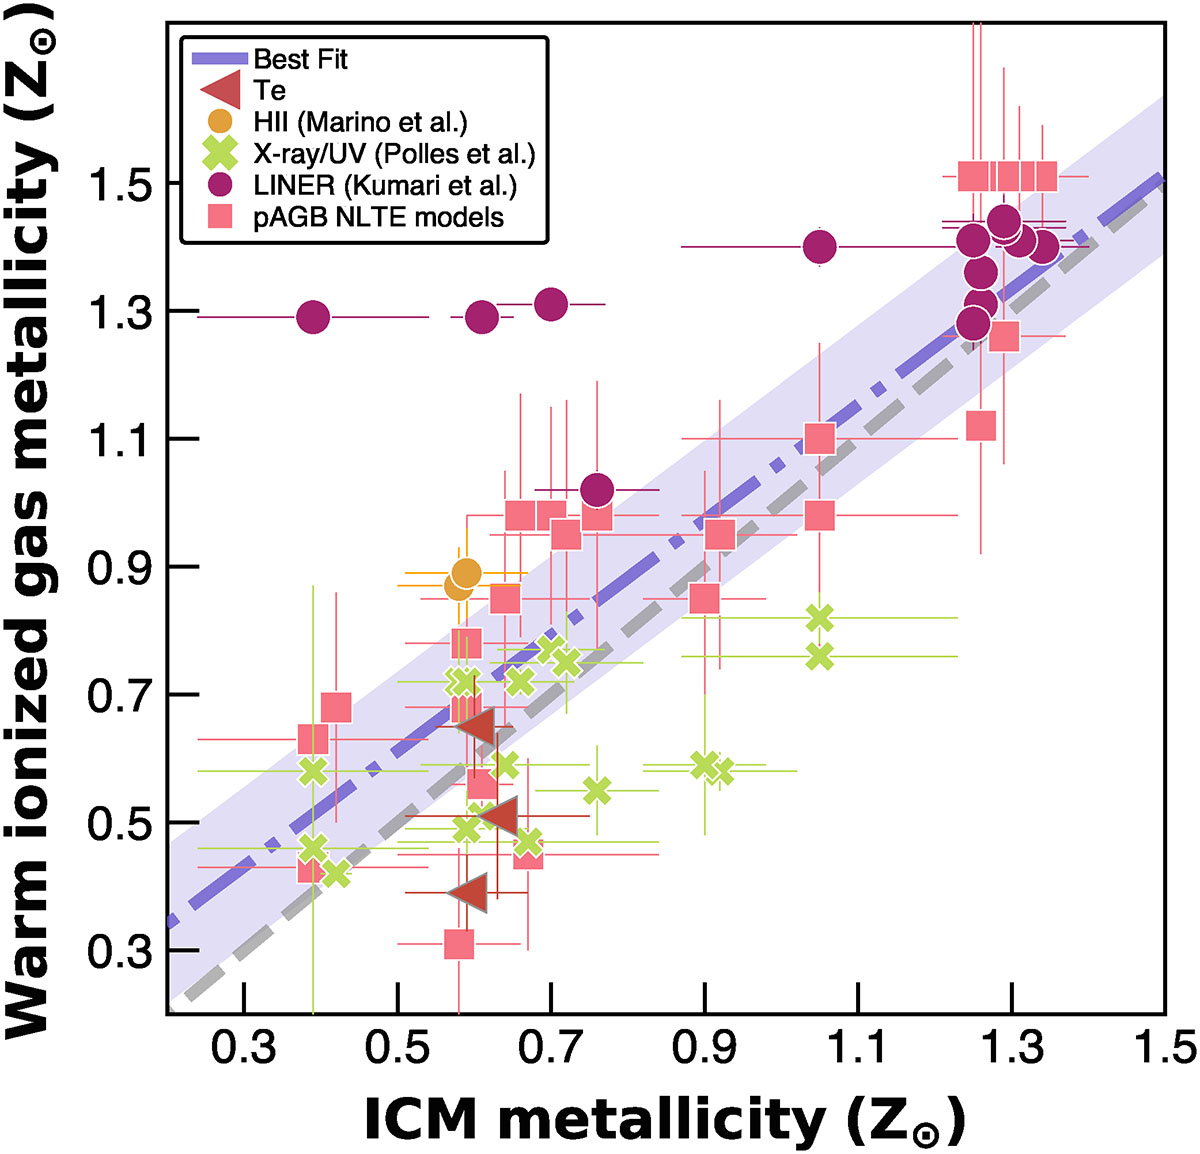
Comparison of warm and hot-gas phase metallicities for a sample of sources using MUSE and Chandra observations. We derived the warm gas metallicity using various calibration methods, depending on the source and their ionization mechanism. For LINER-like regions and sources (magenta circles), we used the Kumari et al. (2019) calibration. For HII-dominated regions, we used the Marino et al. (2013) calibration (yellow circles). Composite and LINER region derived using pAGB models are shown with pink rectangles. The warm-phase metallicity obtained from X-ray/EUV models are shown with green crosses. Three sources, including MACS 1931.8-2635, have warm-gas metallicity measurements using the Te-direct method (red inverted triangles). The errors for the warm gas phase abundance we included both the uncertainties associated with the calibration and 1σ deviation for the regions. The dashed purple line corresponds to the best fit, and the dashed region corresponds to 1σ uncertainty. The dashed gray line shows the one-to-one relation. The best fit corresponds to ![]() .
.
Current usage metrics show cumulative count of Article Views (full-text article views including HTML views, PDF and ePub downloads, according to the available data) and Abstracts Views on Vision4Press platform.
Data correspond to usage on the plateform after 2015. The current usage metrics is available 48-96 hours after online publication and is updated daily on week days.
Initial download of the metrics may take a while.