Fig. B.1.
Download original image
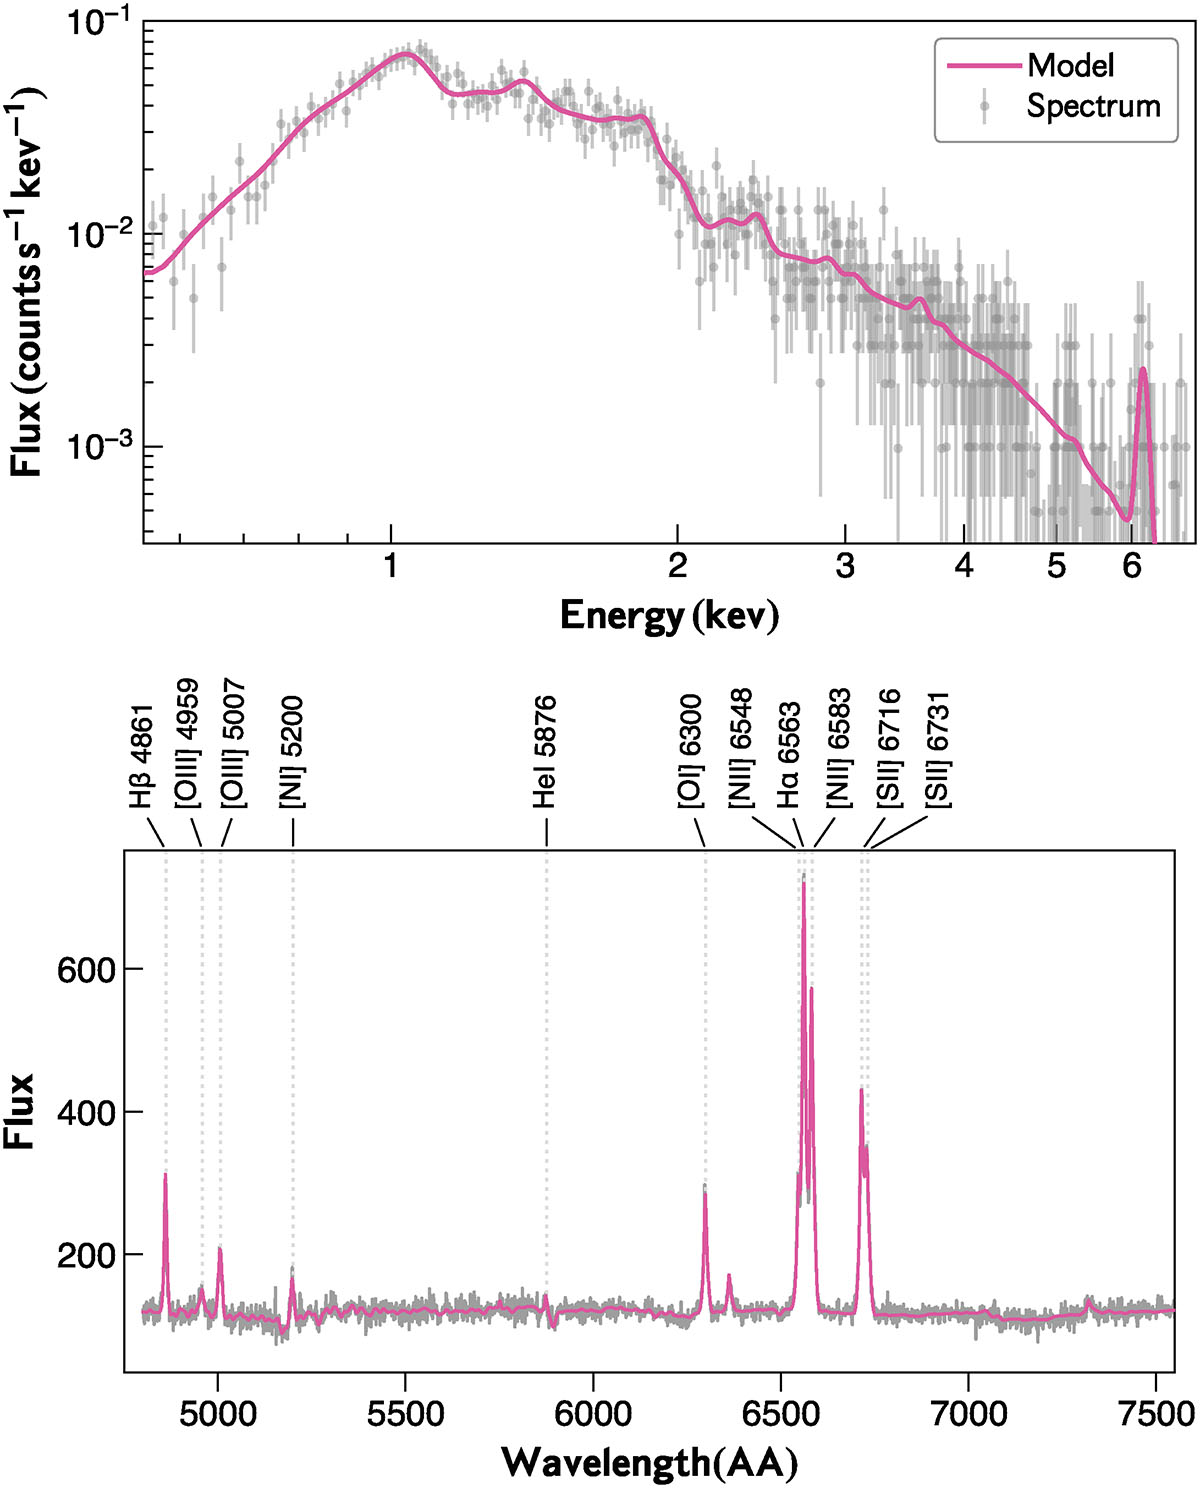
Top: Example X-ray spectrum of Abell 2597 from one of the two regions used to derive the hot gas-phase metallicity. The observed spectrum, corresponding to one Chandra observation, is shown as gray data points, while the best-fit model is overlaid in pink. Bottom: Example of MUSE spectrum of one spaxel of Abell 2597 shown in gray, and the best fit model is shown in pink.
Current usage metrics show cumulative count of Article Views (full-text article views including HTML views, PDF and ePub downloads, according to the available data) and Abstracts Views on Vision4Press platform.
Data correspond to usage on the plateform after 2015. The current usage metrics is available 48-96 hours after online publication and is updated daily on week days.
Initial download of the metrics may take a while.