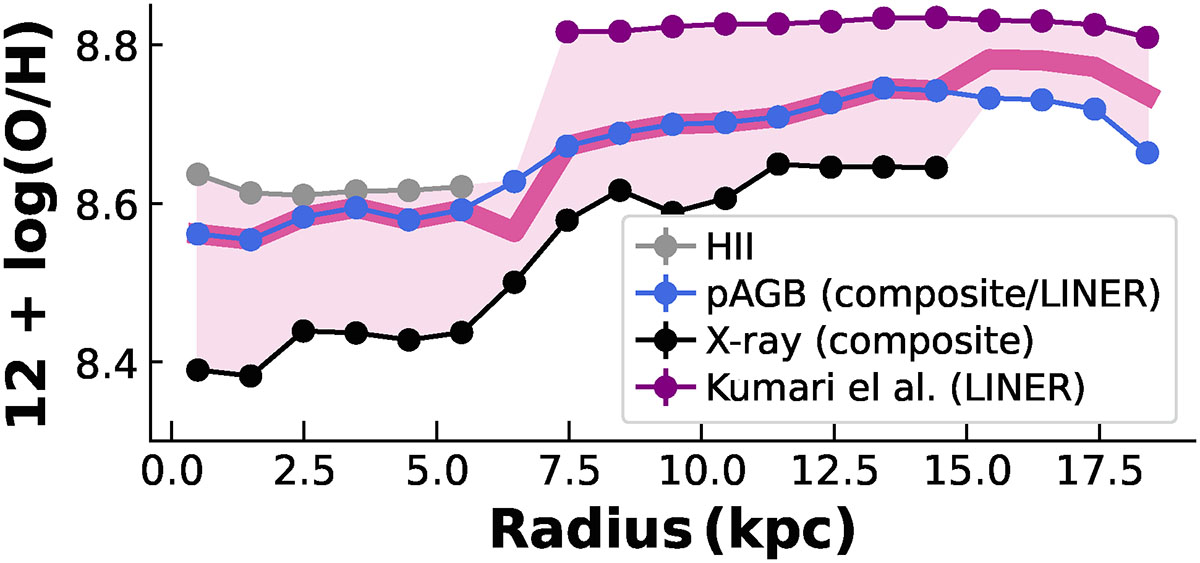
Fig. C.1.
Download original image
Comparison of O/H abundance profiles derived from the different O/H maps: X-ray/EUV and pAGB models, and HII and LINER calibration for RXJ0821. The median O/H profile is indicated by the pink line. O/H abundances profile derived from composite and LIN(E)R spaxels using X-ray and pAGB models, and LINER calibration are shown as blue, black, and purple points, respectively, while values obtained from H II spaxels are shown as gray points.
Current usage metrics show cumulative count of Article Views (full-text article views including HTML views, PDF and ePub downloads, according to the available data) and Abstracts Views on Vision4Press platform.
Data correspond to usage on the plateform after 2015. The current usage metrics is available 48-96 hours after online publication and is updated daily on week days.
Initial download of the metrics may take a while.