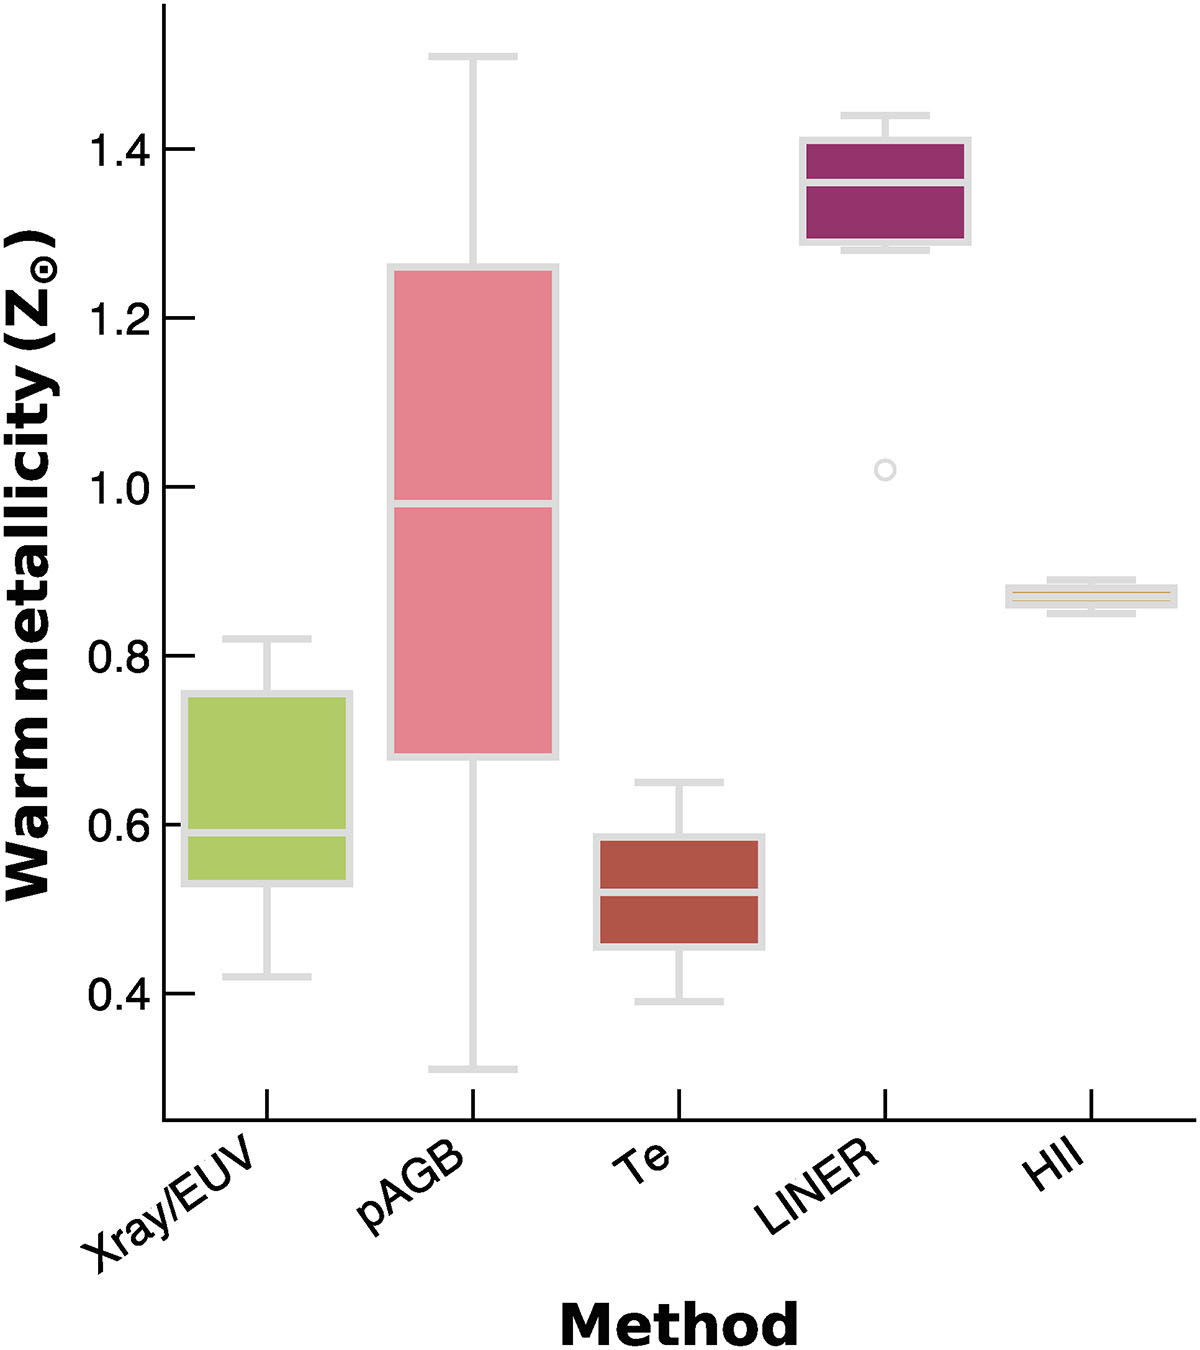
Fig. C.2.
Download original image
Diagram showing the metallicity ranges found in our sample using different methods throughout the paper. The green bar represents metallicity from X-ray/EUV models. Note that the X-ray/EUV method is limited to metallicities below 1 Z⊙. The pink bar shows pAGB stars results, the red bar indicates Te metallicities. The magenta bar shows LINER O3N2 measurements, while the gray bar correspond to results from HII O3N2 calibration.
Current usage metrics show cumulative count of Article Views (full-text article views including HTML views, PDF and ePub downloads, according to the available data) and Abstracts Views on Vision4Press platform.
Data correspond to usage on the plateform after 2015. The current usage metrics is available 48-96 hours after online publication and is updated daily on week days.
Initial download of the metrics may take a while.