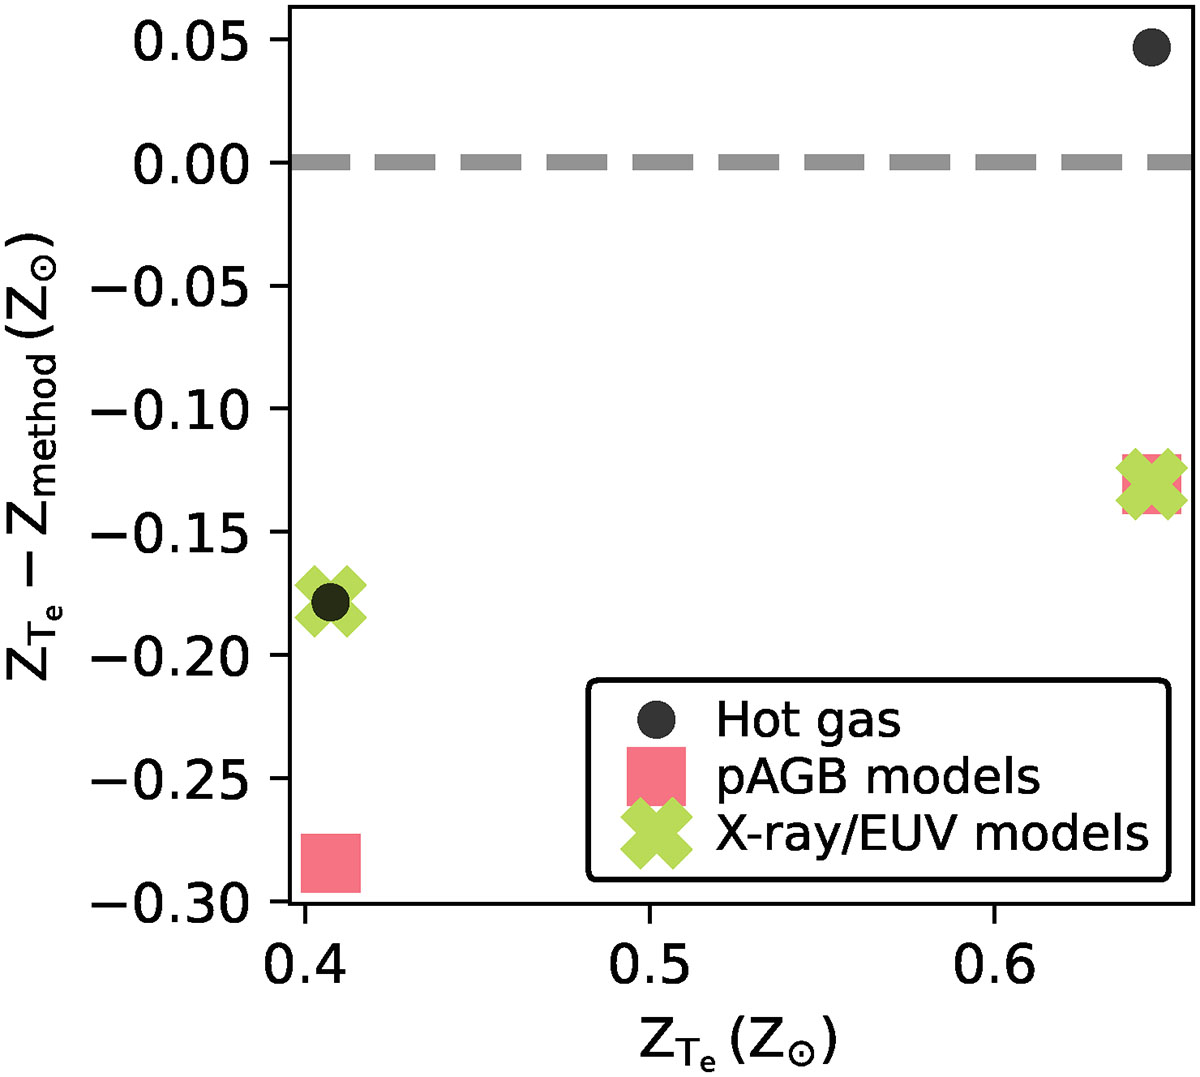
Fig. C.3.
Download original image
Comparison of the Te abundance measurements with alternative methods. The plot shows the difference between metallicities obtained with Te and other methods versus the Te-derived metallicity for two sources. Green represent metallicities derived from X-ray/EUV models, while pink squares correspond to values derived assuming photoionization by post-AGB stars. Black dots corresponds to the metallicity of the hot gas.
Current usage metrics show cumulative count of Article Views (full-text article views including HTML views, PDF and ePub downloads, according to the available data) and Abstracts Views on Vision4Press platform.
Data correspond to usage on the plateform after 2015. The current usage metrics is available 48-96 hours after online publication and is updated daily on week days.
Initial download of the metrics may take a while.