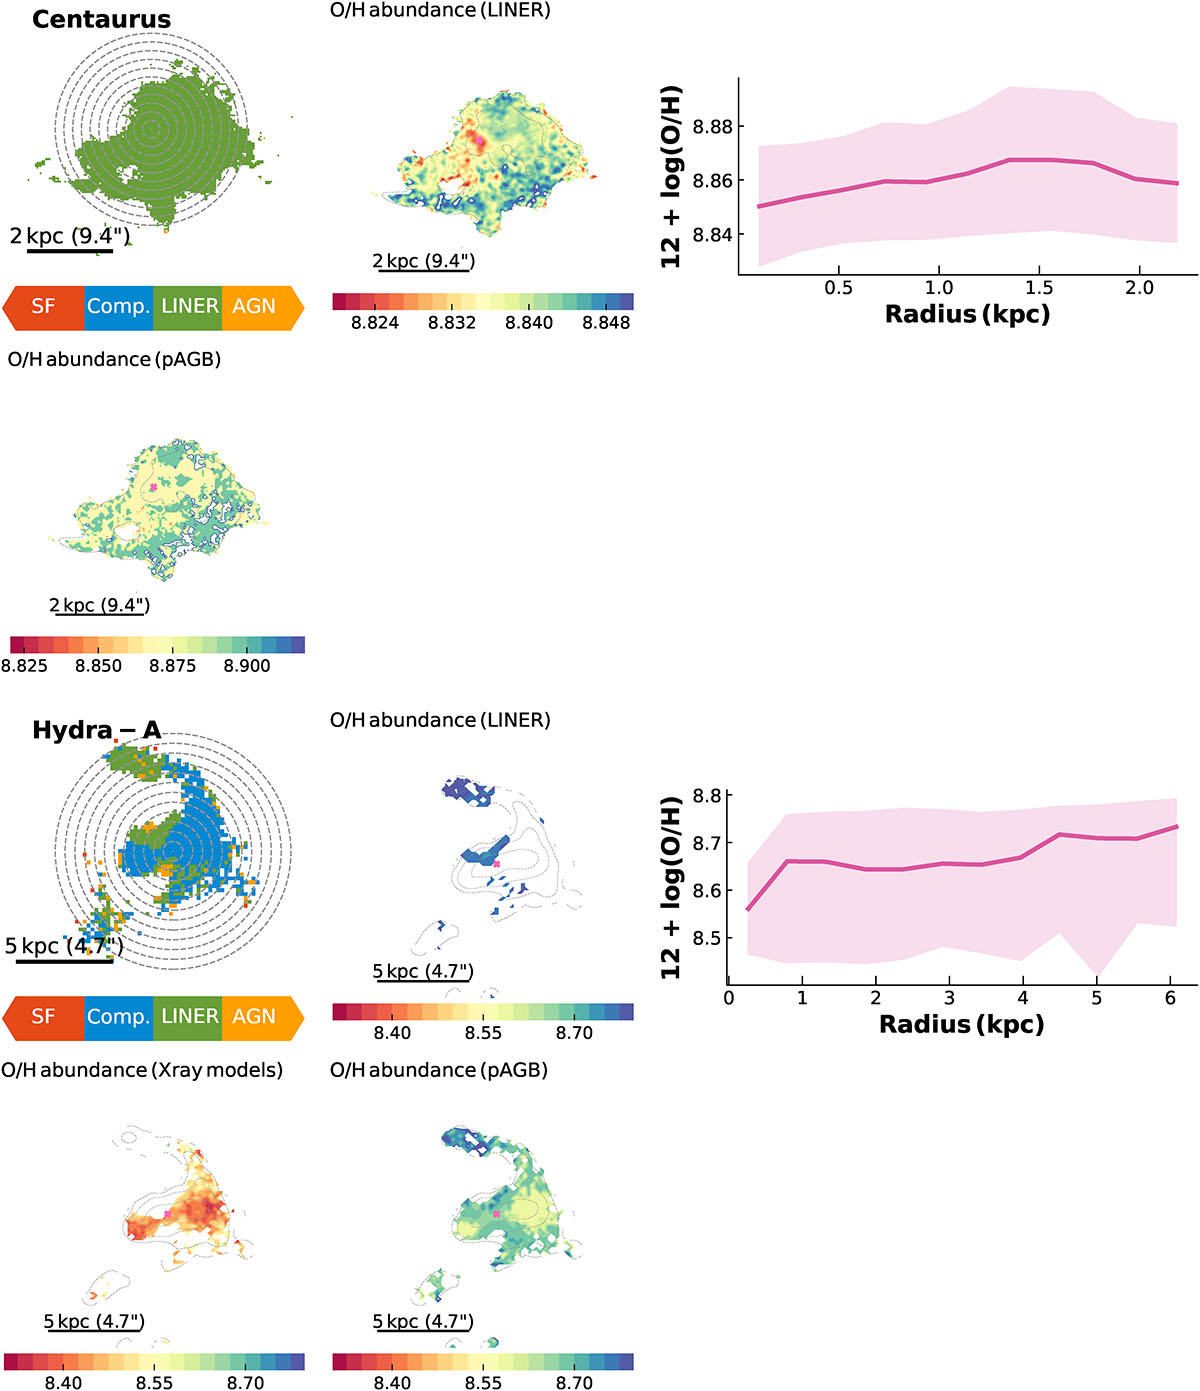
Fig. D.1.
Download original image
Examples of O/H abundance profiles from our sample, illustrating both cases where central O/H drops are detected (e.g., Centaurus, RXJ0821+0752). Upper left panel: Spatially resolved BPT diagram showing regions classified as AGN (yellow), LINER (green), composite (blue), and HII (red). The gray circles indicate the annulus used to derive O/H abundances. Upper middle panel: O/H abundance map derived using the LINER calibration for the LINER spaxels. Upper right panel: Median radial profile of the warm gas O/H abundance, computed using calibrations and models appropriate for each spaxel depending on the ionization mechanism. The shaded region shows the 85% confidence interval, estimated via bootstrapping, and reflects the range of O/H values obtained from the different methods. Bottom left, middle, and right panels: O/H abundance maps derived using the X-ray/EUV and pAGB models for the composite and LINER ionization, respectively. O/H abundance maps derived using HII calibration for the SF dominated spaxels (if applies). The pink cross shows the center of the galaxy.
Current usage metrics show cumulative count of Article Views (full-text article views including HTML views, PDF and ePub downloads, according to the available data) and Abstracts Views on Vision4Press platform.
Data correspond to usage on the plateform after 2015. The current usage metrics is available 48-96 hours after online publication and is updated daily on week days.
Initial download of the metrics may take a while.