Fig. 11
Download original image
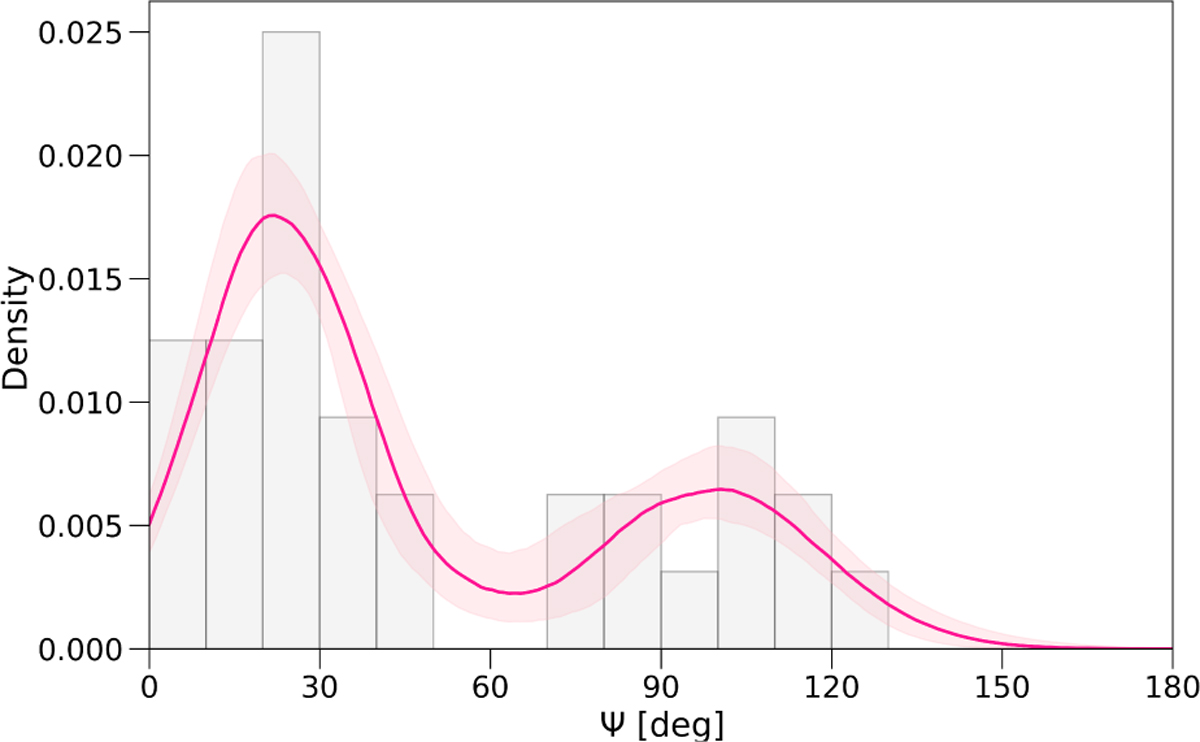
True obliquity distribution of the subsample of 28 Neptunes. The pink solid line represents the best fitting two-component Gaussian mixture model, obtained after 1000 perturbations of the planetary obliquities in their uncertainty range. The shaded light pink area represents the 68% CI. The two components are well separated by an Ashman factor D = 4.33.
Current usage metrics show cumulative count of Article Views (full-text article views including HTML views, PDF and ePub downloads, according to the available data) and Abstracts Views on Vision4Press platform.
Data correspond to usage on the plateform after 2015. The current usage metrics is available 48-96 hours after online publication and is updated daily on week days.
Initial download of the metrics may take a while.