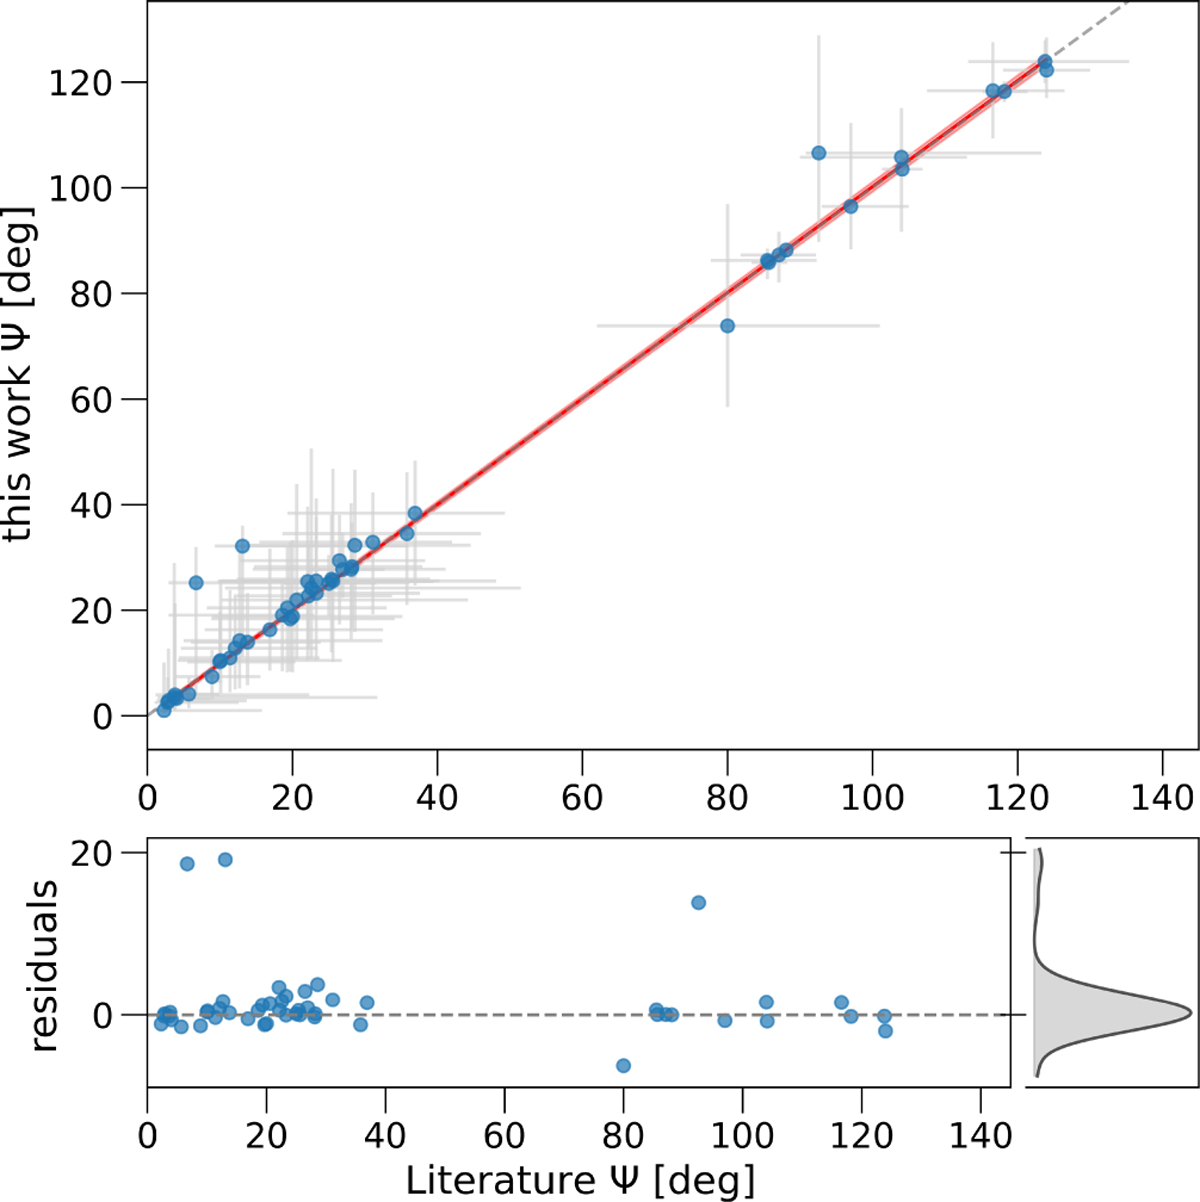
Fig. 2
Download original image
Comparison between our true obliquities and those computed by Albrecht et al. (2021). Starting from the same dataset, we achieve an excellent agreement within the 68% confidence interval of the linear fit. The gray dashed line represents the y = x relation. The linear correlation is guaranteed by a χ2 test yielding p = 1.0, allowing the rejection of the null hypothesis that the data are not linearly correlated. The residuals are computed with respect to the fit line. Uncertainties in the residuals panel are omitted to ensure better readability. The presence of outliers is due to our inability to recover the iorb values used by Albrecht et al. (2021), but also highlights their importance for a correct inference.
Current usage metrics show cumulative count of Article Views (full-text article views including HTML views, PDF and ePub downloads, according to the available data) and Abstracts Views on Vision4Press platform.
Data correspond to usage on the plateform after 2015. The current usage metrics is available 48-96 hours after online publication and is updated daily on week days.
Initial download of the metrics may take a while.