Open Access
Fig. 3
Download original image
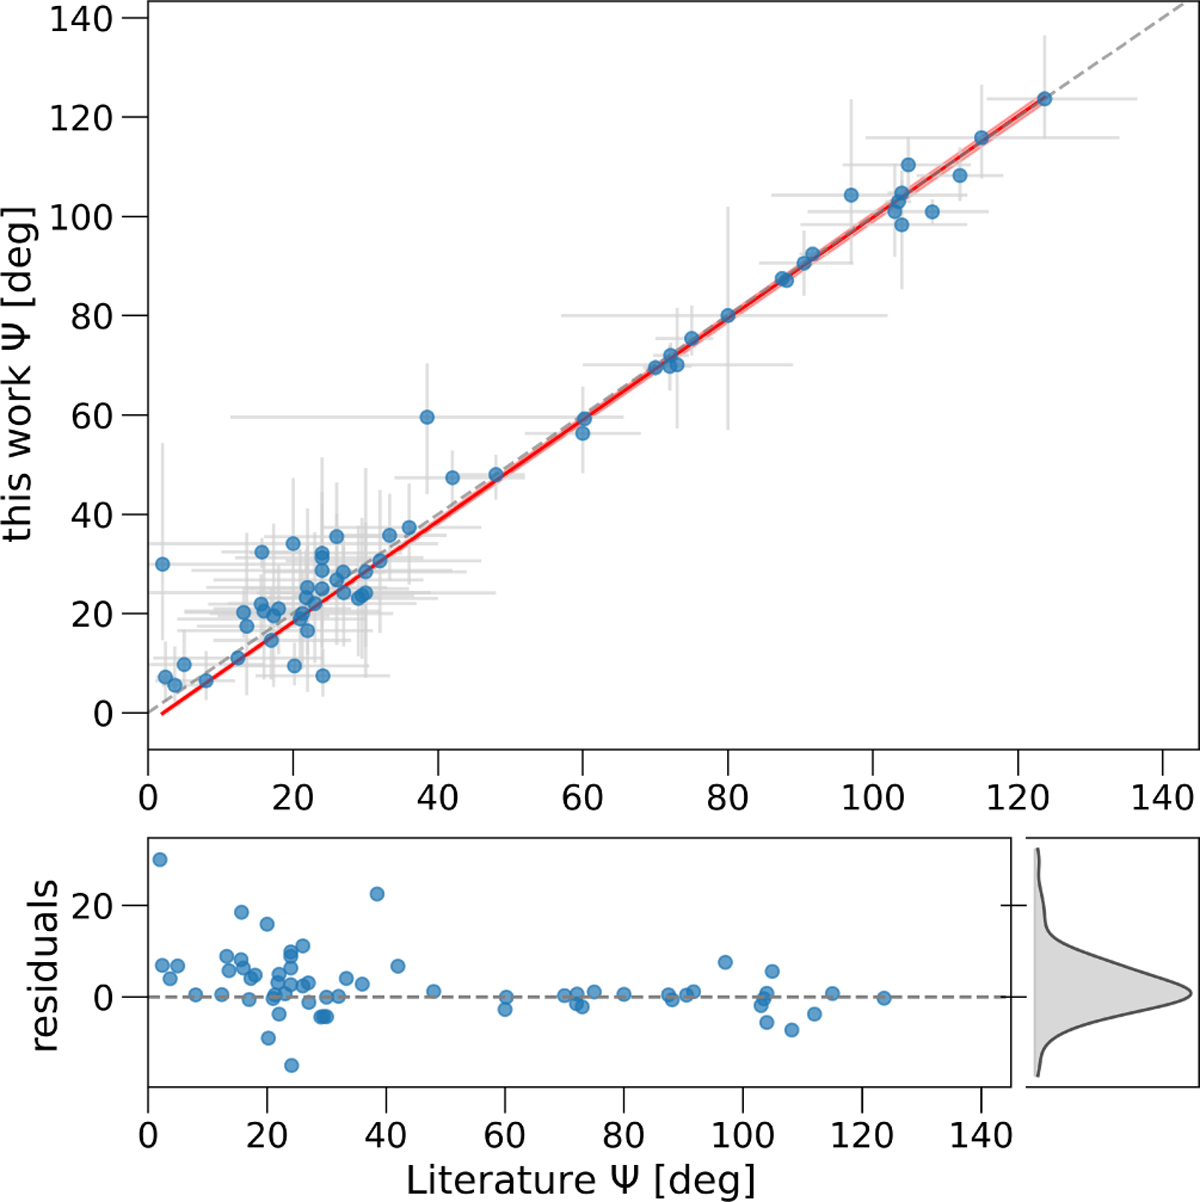
Comparison between the true obliquities computed in this work and the corresponding literature values, where available, but excluding Albrecht et al. (2021). The figure adopts the same plotting style as Fig. 2. The plot is made assuming the conventional stellar inclination (i* ≤ 90°).
Current usage metrics show cumulative count of Article Views (full-text article views including HTML views, PDF and ePub downloads, according to the available data) and Abstracts Views on Vision4Press platform.
Data correspond to usage on the plateform after 2015. The current usage metrics is available 48-96 hours after online publication and is updated daily on week days.
Initial download of the metrics may take a while.