Fig. 4
Download original image
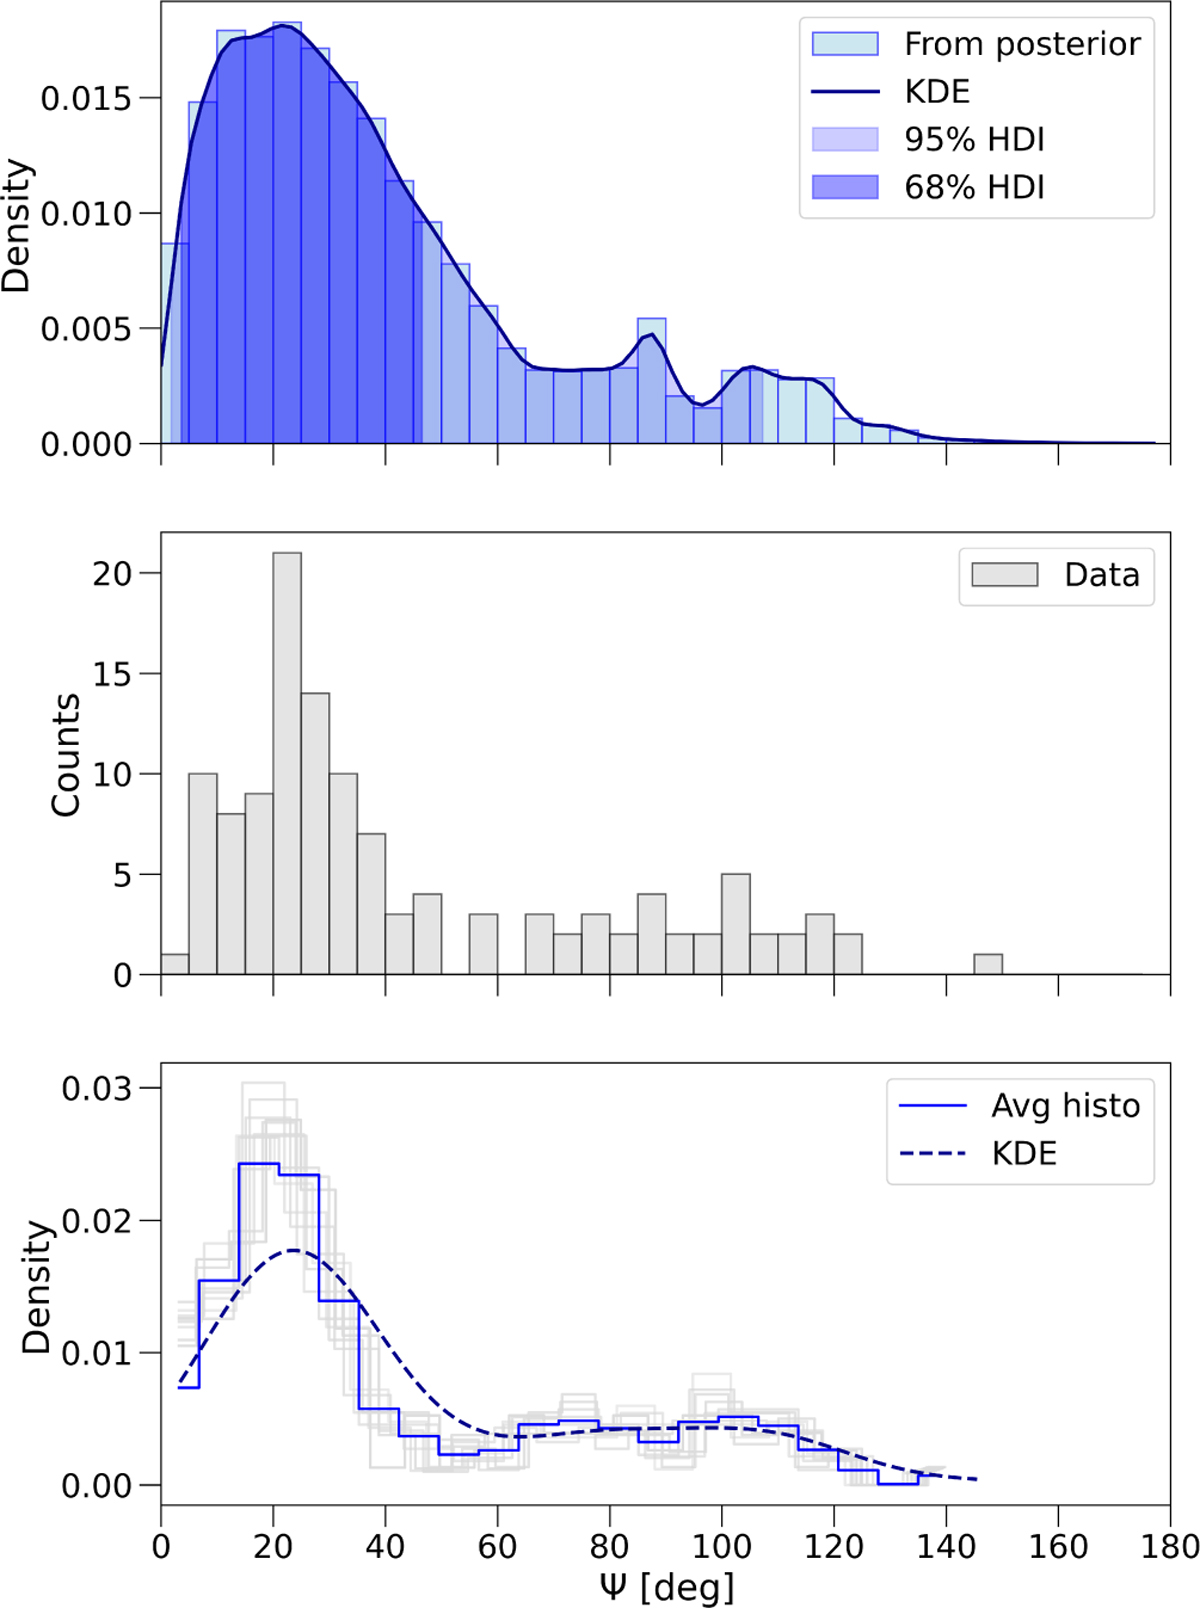
Distribution of the 120 true obliquities present in our sample. In the top panel, the Ψ values are shown as a superposition of their normalized posteriors, fitted with a kernel density estimation (KDE) with a Gaussian kernel and Silverman’s bandwidth (other bandwidth selections yielded similar results or overfitted graphs). The shaded blue and light blue regions respectively represent the 68 and 95% highest density intervals (HDIs). The middle panel displays a simple histogram of true obliquities. The lower panel addresses two key issues: (i) the arbitrariness of binning; (ii) the apparent valley around 90°–100°. To account for these issues, 100 histograms with 20 bins were generated, with 20% variability on their boundaries. The average histogram is represented by the solid blue line, while the dashed blue line represents the KDE.
Current usage metrics show cumulative count of Article Views (full-text article views including HTML views, PDF and ePub downloads, according to the available data) and Abstracts Views on Vision4Press platform.
Data correspond to usage on the plateform after 2015. The current usage metrics is available 48-96 hours after online publication and is updated daily on week days.
Initial download of the metrics may take a while.