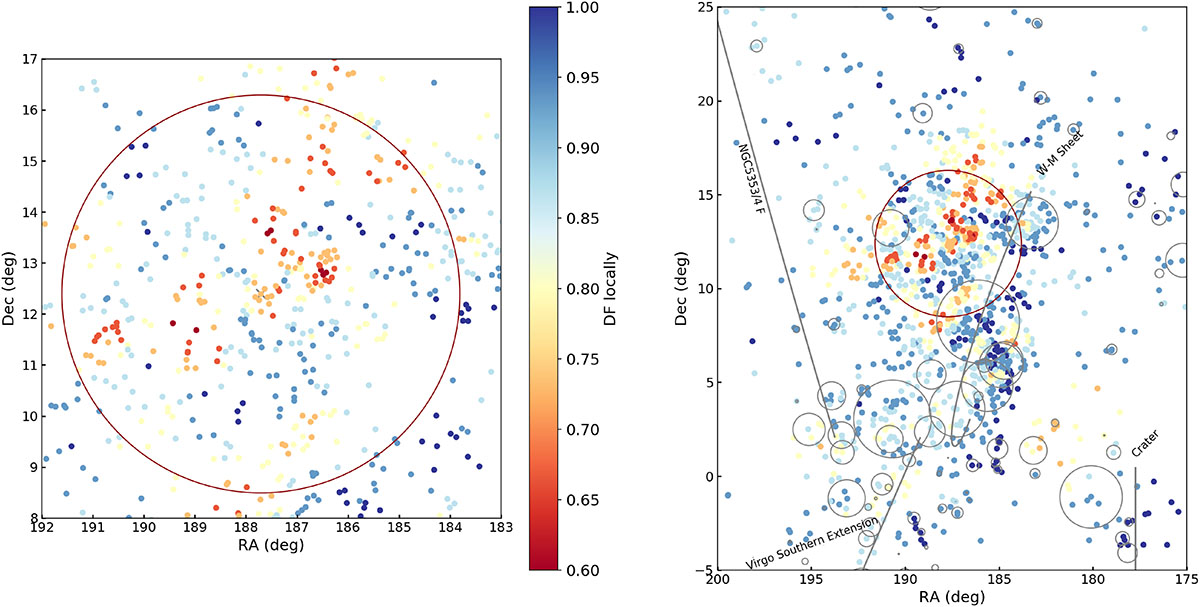
Fig. 3.
Download original image
Galaxy spatial distribution in EVCC area. The red circle highlights the R200 radius of the Virgo cluster. Left: DF in cluster region. Right: DF in entire field of view of EVCC catalogue. The grey circles highlight the groups from the galaxy group catalogue of Kourkchi & Tully (2017). The northern grey lines highlight the filaments of the Castignani et al. (2022b) catalogue. The two filaments in the south were extracted from Fig. 2 of Castignani et al. (2022a). The colour bar in each panel denotes the DF associated with each galaxy, as quantified by considering its 15 nearest neighbours.
Current usage metrics show cumulative count of Article Views (full-text article views including HTML views, PDF and ePub downloads, according to the available data) and Abstracts Views on Vision4Press platform.
Data correspond to usage on the plateform after 2015. The current usage metrics is available 48-96 hours after online publication and is updated daily on week days.
Initial download of the metrics may take a while.